
A phone is more than just technology. It’s minerals, too.
Minerals are essential to the devices we use, the infrastructure we depend on and industries across the country. Getting those materials from the ground to the products we use, however, involves complex global supply chains.
USGS scientists track mineral production, demand and trade around the world. Where minerals come from, how concentrated their supply is and how easily supplies could be disrupted all help reveal potential risks to U.S. industries and the economy.
Each year, the USGS publishes Mineral Commodity Summaries, which brings together data on more than 90 mineral commodities across 180 countries. The report covers U.S. production, imports, exports, consumption and recycling, as well as global production, reserves, prices and market trends.
These data also help inform the Nation’s List of Critical Minerals, which identifies minerals essential to economic and national security that are vulnerable to supply chain disruptions. The 2025 list includes 60 mineral commodities.
The next time you pick up your phone, remember that the minerals inside it are part of a global supply chain. USGS science helps decision makers understand these connections and prepare for potential disruptions.
📸 1: Bastnaesite is a source of rare-earth elements used to produce magnets in speakers, microphones, and vibration motors.
📸 2: Chalcopyrite is a source of copper, the most abundant metal in a mobile device. Copper conducts electricity and heat, making it essential to electronics.
📸 3: Sphalerite is a source of indium and germanium. Indium is used in conductive coatings on smartphone screens, while germanium is used in displays and LEDs.
Credit: USGS
What lies beneath Crater Lake’s deep blue waters?
The caldera of an ancient volcano! This USGS geologic map reveals clues to Mount Mazama’s dramatic volcanic past, including the geology of the lake floor.
Mount Mazama began erupting about 420,000 years ago, building a massive volcano through repeated episodes of volcanic activity. About 7,700 years ago, a series of explosive eruptions caused its summit to collapse, forming the caldera that Crater Lake fills today. At 1,949 feet (594 meters) deep, Crater Lake is the deepest lake in the United States.
By mapping volcanic rocks, lava flows and eruption deposits across the landscape and on the lake floor, USGS scientists can reconstruct past eruptions, investigate how magma moved through Earth’s crust and better understand how large volcanic systems grow and evolve. This research also helps scientists evaluate volcanic hazards in the region.
As we near the end of Earth Science Week, celebrate Geologic Map Day by exploring the USGS National Geologic Map Database, where you can find this map of Crater Lake and thousands of other geologic maps: ngmdb.usgs.gov/
📸1: Portion of the Geologic Map of Mount Mazama and Crater Lake Caldera, Oregon.
📸2: Crater Lake and the surrounding landscape on a bright, clear day in August 2020.
Credit: USGS
#EarthScienceWeek2026
Behind every wildlife refuge is a story of science.
This National Wildlife Refuge Week, we’re celebrating how USGS science helps our U.S. Fish and Wildlife Service partners understand the needs of wildlife and the habitats they depend on.
📷 1: National Elk Refuge, Wyoming: USGS scientists evaluate how feeding strategies affect elk and bison gathering in groups, where diseases such as chronic wasting disease can spread. This research helps inform feeding decisions for approximately 8,000 elk and 500 bison that winter on the refuge and supports the long-term health of elk populations in the Greater Yellowstone region.
📷 2: Izembek National Wildlife Refuge, Alaska: Eelgrass meadows provide habitat for birds, fish and other marine life, as well as food that fuels black brant migrations. USGS tracks eelgrass abundance and distribution to help managers understand changes in this important habitat.
📷 3: Bayou Teche National Wildlife Refuge, Louisiana: USGS researchers are capturing, marking, and recapturing treefrogs to build a baseline understanding of their population. Since the refuge sits close to the Gulf, this data will help scientists understand how hurricanes and other natural disasters affect amphibians over time.
📷 4: Guam National Wildlife Refuge: USGS leads efforts to control the invasive brown treesnake, a species responsible for the loss of most of Guam's native birds and millions of dollars in damage to power infrastructure each year. This work protects native wildlife and helps prevent the snake from spreading to new islands, including Hawaii.
Credit: USGS
@USFWS
#NationalWildlifeRefugeWeek
Coral reef or satellite image? 🪸🛰️
If you guessed satellite image, you’re right!
This colorful view of the Lena River Delta in Russia is part of our Earth As Art collection, created using @NASA and @USGSLandsat satellite data.
The Lena River, at 2,800 miles long, is one of the largest rivers in the world. The Lena Delta Reserve is the most extensive protected wilderness area in Russia and is an important refuge and breeding ground for many species of Siberian wildlife.
For Earth Science Week, explore the full Earth As Art collection and discover more striking images that reveal our planet’s remarkable colors, textures and natural patterns from space 👉
ow.ly/2O1t50ZXmbT
#EarthScienceWeek2026
🐸 653 frogs. One big step for a species fighting its way back.
This summer, USGS scientists and partners released 653 critically endangered southern mountain yellow-legged frogs into their native habitat in Southern California, the largest release of the species to date.
These frogs are part of a larger effort to rebuild populations in the San Gabriel Mountains, where the species has faced threats from wildfire, drought, disease, non-native predators and habitat loss.
The work starts long before a frog reaches the mountains. Scientists and zoo partners rear tadpoles and froglets in captivity, then release them into carefully selected habitat. USGS researchers study the frogs after release to learn how they survive, grow and reproduce in the wild. That information helps scientists understand what it takes to establish healthy, self-sustaining populations.
With this summer's release, more than 1,000 mountain yellow-legged frogs have now been reared and released into the San Gabriel Mountains as part of this conservation effort.
It takes scientists, zoos and federal and state partners working together to give this endangered species a chance to recover.
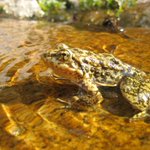
📷 1: Endangered mountain yellow-legged frog (Rana muscosa).
📷 2: A newly released mountain yellow-legged frog.
📷 3: USGS biologists and partners climbing to a release site in the San Gabriel Mountains.
📷 4: Frogs in their transport containers waiting to be released.
Credit: USGS
#frogs #amphibian #SanGabrielMountains
Going to bat for bats: A vaccine for white-nose syndrome 🦇
The USGS is playing a crucial role in the research and development of an oral vaccine for white-nose syndrome in bats. White-nose syndrome, which is caused by a fungus, has killed over seven million bats in North America.
The unique vaccine development was spearheaded by research epidemiologist Dr. Tonie Rocke of the USGS National Wildlife Health Center. When Rocke first undertook the development of a vaccine for white-nose syndrome in 2015, few researchers had studied fungal vaccines. Now, a group of federal, state, and local scientists are inoculating bat colonies across the Western United States and studying the vaccine’s effectiveness.
At English Camp in Washington State’s San Juan Island National Historical Park, scientists just vaccinated 450 bats, the largest such vaccination effort so far. Although white-nose syndrome was first discovered in Washington in 2016, it was only just found on San Juan Island. Scientists believe that for the bat colony to survive, it’s crucial to catch the outbreak early.
The effort to inoculate bats against white-nose syndrome is not confined to English Camp. Scientists plan on vaccinating bat colonies in California, Montana, and another colony in Washington. They will continue to monitor the colony on San Juan Island and plan on vaccinating next year’s brood, hoping that this intervention will preserve the colony.
Read the full story: nps.gov/articles/000/san-jua…
📸 1: A scientist holding a bat uses a pipette to administer a vaccine. Credit: Sophia Hammerle, NPS
📸 2: Mist nets set up to collect bats as they exit the colony at English Camp. Credit: Hazel Galloway, NPS
#SpookyScience
USGS retweeted
When you visit Yellowstone, it is common to detect something that smells like rotten eggs. The latest Yellowstone Volcano Observatory video update describes why this smell is a good thing in terms of volcano monitoring, and also shows videos from various geysers and hot springs, including a small hydrothermal explosion in Biscuit Basin on the night of September 27, 2026.
youtu.be/pKJDW8oOXuU
@YellowstoneNPS
USGS retweeted
From liftoff in California to first light over the Himalayas. 🚀🏔️
On Sept. 27, 2021, Landsat 9 launched from Vandenberg Space Force Base, beginning a new chapter in the Landsat mission of recording Earth’s changing land surfaces.
Landsat 9’s sensors brought advanced technology to detect more subtle differences, especially over water and dense forests, and more accurate surface temperature measurements. Together, Landsat 9 and Landsat 8 provide complete global land coverage every eight days.
That repeat coverage is what turns a single image into a story of change. On Oct. 31, 2021, its first day of data collection, Landsat 9 captured this sweeping view of the Himalayas.
Five years and over 26,000 orbits later, the USGS-NASA mission continues to add about 750 new observations per day to a Landsat record more than half a century in the making. Over 1.3 million Landsat 9 products are available to download from the USGS data access portals.
Happy fifth launch anniversary, Landsat 9! 🎉
🔗 Explore more of the Landsat 9 mission: ow.ly/1UJA50ZPM0m
📸1: Landsat 9 launches aboard a United Launch Alliance Atlas V rocket from Vandenberg Space Force Base, California, on Sept. 27, 2021. Credit: NASA
📸2: Landsat 9 image showing Kathmandu, Nepal, (lower left) and the snow-covered Himalayas, glaciers, and glacial lakes across Nepal and China. Acquired Oct. 31, 2021. Credit: USGS
#Landsat9 #EarthObservation #LandsatLegacy
USGS retweeted
It's World Water Monitoring Day. Celebrate by staying prepared! 🌍💧
World Water Monitoring Day is all about understanding and protecting our most vital resource.
For USGS hydrotechs, that mission happens 365 days a year. Our dedicated teams are on the front lines, deploying sensors, measuring streamflow, and tracking water quality to keep communities safe.
Monitoring our waterways isn't just for scientists, though. It's your best tool for emergency preparedness.
Here’s how to stay prepared:
💧 Explore the National Water Dashboard: Check real-time streamflow, groundwater levels, and weather alerts on an interactive map.
💧 Subscribe to WaterAlert: Set up text or email alerts for rivers and creeks near you to get updates if water rises.
💧 Check water quality: Monitor local waterways to see how your watershed is doing.
Knowledge is your best defense.
This World Water Monitoring Day, be prepared. Track your local waterways, know your risk, and always follow local safety guidance.
Explore USGS water monitoring tools - waterdata.usgs.gov
📷 1: USGS hydrologic technician reads measurements from a streamgage while sitting on a partially submerged park table in Zephyrhills, Florida in 2024 just days after Tropical Storm Debby struck Florida's Gulf Coast. Credit: Todd Dunkle, USGS.
📷 2: USGS hydrographer measuring streamflow using a handheld Acoustic Doppler Velocimeter in fast moving floodwater Cajon Creek near Keenbrook, California. Credit: USGS.
📷 3: USGS hydrologic technician takes a high flow measurement on Chartiers Creek in Carnegie, PA during flooding from remnants of Hurricane Ida.
📷 4: A USGS crew measures high flow during flooding on the Maple River near Mapleton, North Dakota. The instrument being pulled across the water is an acoustic Doppler current profiler, which is used to measure streamflow. Credit: USGS.
#StayPrepared #NationalPreparednessMonth #WorldWaterMonitoringDay
USGS retweeted
Kīlauea Update 🌋
New vents that opened in Halemaʻumaʻu at Kīlauea’s summit on September 14-15 continued to erupt lava flows today, September 16. This activity is occurring within the summit caldera in Hawai‘i Volcanoes National Park.
The vents are on or near the northwest wall of Halemaʻumaʻu crater, just north of the existing vent complex that has been erupting lava fountains episodically since December 2024. Here’s a summary of observations from the USGS monitoring overflight this morning:
🔸 Lava continued to erupt from at least one of the five new vents, feeding lava flows on the crater floor
🔸 Spattering at the north vent continues to add to the cone that surrounds it, which is about 30-feet-high, with a 12-foot-wide opening
🔸 Spatter was also visible in the south and west vents
For more than a week, small lava flows and spatter bursts have continued—the longest stretch of low-level activity in this eruption since it began in December 2024.
Ground deformation patterns and earthquake activity indicate that the summit region of Kīlauea remains pressurized. This low-level eruptive activity could continue or additional changes could occur. USGS Hawaiian Volcano Observatory scientists continue to closely monitor Kīlauea and will issue additional notices as needed. All current activity is confined to the summit region of Kīlauea within Hawaiʻi Volcanoes National Park.
📹: Video compilation shows eruptive activity during a USGS Hawaiian Volcano Observatory monitoring flight the morning of September 16, 2026.
#Kilauea #Eruption #Lava
Preparedness starts with good information.
Before, during and after natural hazards, emergency managers need reliable information to understand what’s happening and make informed decisions.
USGS scientists collect, monitor, and analyze data on hazards such as earthquakes, floods, landslides, and volcanoes. We provide that science and data to emergency managers and other partners to help them prepare for and respond to hazards and their potential impacts on communities.
📷 1: Following the 2019 Ridgecrest earthquake sequence in California, USGS scientists worked with partners to document fault ruptures at the Earth’s surface. Here, USGS research geologist Belle Philibosian measures a fault offset in the Ridgecrest area. Credit: Katherine Kendrick, USGS
📷 2: In June 2023, USGS Hawaiian Volcano Observatory scientists monitored the ongoing Kīlauea summit eruption from an area of Hawai‘i Volcanoes National Park closed to the public for safety. Credit: USGS
📷 3: In October 2017, USGS scientists used a drone to capture photos and video of the Mud Creek landslide along California’s Big Sur coast. Credit: Shawn Harrison, USGS
📷 4: On October 7, 2024, USGS hydrologic technician Julie Hobbs installed a wave sensor near Venice, Florida, ahead of Hurricane Milton’s projected landfall along Florida’s Gulf Coast. Credit: Sean Townsend, USGS
#NationalPreparednessMonth
Why do scientists put bands on birds? KD1 gives us a chance to explain. 🦅
If you’ve been following the Big Bear Lake, California bald eagle family, you may have noticed a new eagle at the nest. KD1 (Kaydee) has recently been seen in the nest with Shadow following the loss of Jackie.
The band on KD1’s leg is more than an identification tag. It connects this eagle to the USGS’s Bird Banding Laboratory (BBL), which maintains more than 100 years of bird banding and encounter data.
The BBL manages more than 7,700 federal bird banding and marking permits and distributes more than 1 million bird bands each year. These data help scientists study bird movements, survival and populations.
Bald eagles are a powerful example of why this long-term science matters. Once severely threatened by contaminants such as DDT, their populations have made an extraordinary comeback.
From one banded eagle to more than a century of data, every observation helps tell the story.
Learn more about why we band birds: ow.ly/Mhfr50ZLyCw
📷: Image courtesy of Friends of Big Bear Valley
Wildlife comes in all shapes, sizes and…gymnastic abilities. 🤸♂️
For National Wildlife Day, we're highlighting this rough-skinned newt (Taricha granulosa) from the Pacific Northwest.
Rough-skinned newts are known for their bright orange bellies and their ability to produce a powerful toxin that helps protect them from predators. They also have some unusual behaviors, including this defensive posture known as an “unkenreflex.”
We're not sure what this move is called in the gymnastics world, but we're impressed!
From amphibians to mammals, wildlife has evolved a wide range of adaptations and behaviors that help animals survive in their environments. USGS science is used by managers, policy makers, and others for decisions that conserve and enhance healthy fish and wildlife populations across the U.S.
Learn more about the USGS Species Management Research Program: ow.ly/LCWs50ZJy0f
📸: Rough-skinned newt in defensive posture, EPA ponds, Corvallis, OR. Credit: Brome McCreary, USGS
#NationalWildlifeDay
🚨 An updated view of the Nation’s geology is now available!
The USGS National Cooperative Geologic Mapping Program has expanded the Cooperative National Geologic Map to include Alaska, Hawaii, and U.S. territories.
The map brings together decades of geologic mapping by state and federal surveys into an integrated, standardized view of the Nation’s geology. It provides information about geologic features at and beneath the land surface and provides insights into:
🔹The age and composition of geologic units across regions
🔹The regional distribution of geologic materials, which inform decisions about natural resources and geologic hazards
This expanded national view of our geology can help inform land-use decisions, infrastructure planning, natural resource management, and national security.
The map interface is a product of the National Geologic Map Database (NGMDB), a Federal-State collaborative effort that brings standardized geologic information to the public. This Cooperative map is integrated with the overall NGMDB database, which gives users access to more detailed maps and information about the Nation’s geology.
Learn more: ow.ly/3NcU50ZIXJL
📷: Portions of the updated map showing Alaska, Hawaii, and Puerto Rico.
Gold in the trash? Not quite. But some mine waste may hold valuable minerals we need today. 🪨
Many of these minerals are essential to modern technologies and are found alongside commodities like gold, zinc, and coal. Mineral production, however, requires moving a lot of rock to reach the minerals we want. “Mine wastes” are the minerals and other materials left behind after the targeted minerals have been mined, processed, and refined.
Could mine waste, whether from legacy sites or current mining operations, become a new source of critical minerals and provide a way to help strengthen domestic mineral supply chains?
USGS scientists study mine wastes to:
⛏️Understand their potential as a source of critical minerals and other commodities
⛏️ Inform reclamation of mine lands
⛏️ Improve current and future mining operations
It’s part of a broader effort to strengthen domestic mineral supply chains and better understand the resources already present across the U.S.
🔗 Learn more: ow.ly/CpcQ50ZIutP
📹 Video Description: The video shows historical and modern mining scenes, with aerial views of abandoned mine lands, scientists collecting samples in the field and in the lab, and close-ups of rocks and minerals. On-screen text and narration explain how USGS studies mine waste to identify valuable critical minerals.
USGS and the University of Nebraska–Lincoln have released Nebraska’s first-ever statewide map of surface geology, revealing the wind-blown sand, silt and other sediments covering more than 75% of the state. The map supports aquifer, habitat, resource and geohazard research.
🔗ow.ly/OH7x50ZGKR3


