

Ex-sell side/buy side. Spent years writing research nobody read on stocks everybody owned. Now writing research people actually want on stocks nobody covers.
England, United Kingdom
Joined March 2026
- Tweets195
- Following279
- Followers1.9K
- Likes254




mostly agree with this but I think people are overcorrecting a bit. the model was never really where the edge was, the good analysts I've worked with could build one fine but what made them good was knowing which 2 or 3 lines actually mattered and why
the intangibles stuff is right too, accounting is pretty useless at capturing it (Baruch Lev's The End of Accounting makes it at length) but it does show up in the numbers eventually, you see it in returns on capital, incremental margins, how much they can reinvest and at what rate. so I'd still want the spreadsheet, just as a way of checking whether the "network of know-how" story is real or just a nice narrative
AI building the 3 statement in 2 mins is great tbh, means more time spent on the bit that actually matters

if you're into "financial models", pivot to ontologies. You need to think about firms as networks of complementary knowledge and know-how, not as a bunch of numbers on a spreadsheet. Accounting doesn't give you any view into the thing that actually matters (and will matter more and more going forward): how intangibles combine to create economic value.
Firms with economically valuable configurations of knowledge / know-how can deploy capital at attractive returns. Those with a differentiated ability to learn from deployment (accrue more economically valuable knowledge/know-how) absorb more capital over time.
Organisms / species with adaptive mutations absorb energy at high rates and use that energy more efficiently (become more selectively adaptive).
Are you getting it now?
I've been trying to understand the unit economics of a single $CRWV contract, prompted by this GS note arguing new contracts clear a ~15% unlevered IRR. I rebuilt that maths as a simple model and flexed the assumptions. Some observations below. Very open to being told where it's wrong.
Setup: one 200MW contract with capex up front and a 5-year term. 80% is debt-funded through self-amortising asset-level loans (the DDTL structure). Outputs are unlevered IRR, equity IRR, DSCR and breakeven revenue per MW.
1. The ~15% reproduces, but it's sensitive. At $13m/MW of annual revenue and $30m/MW of capex, I get about 15% after tax. At the current blended ~$10m/MW it's closer to 6%. The breakeven for 15% is about $12.9m/MW, so the base case sits close to the hurdle.
2. Price and capex matter about equally. Roughly, +$1m/MW of price adds 3pts of IRR, and +$2m/MW of capex takes off 2.5pts. Newer GPU generations raise both.
3. With updated inputs, returns look close to the cost of capital. I used $12m/MW pricing, $34m/MW capex, a 3-month ramp, some re-lease value and minimal cash tax given the NOLs. That gives about 11–12% unlevered, against an estimated project cost of capital of about 11%.
4. Financing terms make a big difference to equity returns. The same contract funded at IG-style spreads, rather than the wider levels on recent facilities, moves equity IRR from about 15% to about 25%.
5. Vera Rubin economics are the part I'm least sure of. On my capex estimate (~$40m/MW), a 5-year contract returns about 9%. Longer contracts and meaningful residual value bring it to the mid-teens, so the assumption about GPU useful life carries a lot of weight.
6. For context, the parent's unsecured bonds have widened sharply recently, while the asset-level debt has held up much better.
Caveats: this is one stylised contract, not the company. The capex per MW for new generations is an estimate. And the tax and debt-draw treatment are simplified.
If you work on this area and see something off, particularly on capex/MW or contract pricing, I'd genuinely like to hear it.


Goldman upgrade $CRWV to buy as they realize per unit economics good/ progressing positively vs trailing. some strangely familiar points in the upgrade note, interesting -- interesting


I built a cohort model for $CRWV: each year's capex earns contracted revenue, is part-funded by self-amortising secured debt (DDTL-style) and customer prepayments, and anything left over has to come from unsecured debt or equity. It's calibrated to 2026–28 consensus revenue, current depreciation and the H1 2026 loss.
One thing matters a lot here: gross versus cash capex. In 2025, net PP&E rose ~$18.7bn while cash capex was ~$10.3bn; much of the rest was vendor-financed. On a gross basis, each $1 of capex currently supports roughly $0.30 of annual revenue.
The per-dollar maths, roughly:
~$0.30 revenue × ~62% EBITDA margin ≈ $0.19 of EBITDA
minus ~$0.17 of depreciation (6-year life)
minus ~$0.05 of interest
What would change it:
1. Pricing on new contracts. Breakeven at a 6-year life needs roughly $0.36 of revenue per $1, ~20% above today. Recent price increases on new deals point that way.
2. Hardware life. If GPUs keep earning for 8–9 years, today's ~$0.30 is roughly enough. CoreWeave has said some A100s are contracted through 2029.
3. Funding mix. More investment-grade, contract-backed debt like DDTL 4.0 rather than 14–15% unsecured.
Model output
Consensus-like base case: no profit by 2033, ~$100bn+ of cumulative unsecured/equity funding needed
Bull case (higher pricing, 7-year life): profitable now, largely self-funding
What I think is most likely: somewhere between the two, closer to the base case for the next two years.
New contracts look better priced than the existing book, and contracted hardware is likely to earn beyond six years. Both point toward eventual profitability. But the benefit arrives gradually, as older cohorts roll off and newer ones ramp. Meanwhile, capex of $35–50bn a year leaves a residual funding need, likely ~$10bn+ a year through 2027–28, beyond what secured debt and prepayments cover.
So the likely path isn't default, and it isn't a smooth self-funding story either. Expect continued issuance of converts, notes and possibly equity, more structured secured deals, and customers and partners stepping in through prepayments. CoreWeave probably gets there, but existing unsecured holders and shareholders bear the cost through dilution and expensive funding along the way. Notes in the low 80s yielding 14–15% look broadly consistent with that.
The real test comes around 2030–31, when the first large contracts end and re-lease rates show what these GPUs actually earn in their later years.
Caveats: the model is simplified. Part of 2025's additions are data centres not yet earning, margins may expand as consensus expects, and revenue per dollar is held flat. Q3 results on Nov 10 will give a better read on revenue against the growing asset base, and on any change to useful lives.


Does anyone have a thesis as to how/when $CRWV becomes profitable and is able to pay down debt?
The argument that if they were to stop investing/building they would be cash flow positive is irrelevant.
If they stopped building every competitor would pass them by immediately
This is one of the better bull cases for compute I've read, and I agree with more of it than I disagree with. But I think it conflates two different things: the labs surviving, and the owners of compute earning a return.
Where I agree
The survival logic is right. A safety-focused lab that lets itself run out of money doesn't make the world safer. It hands its talent and compute to someone less careful. So commercial pressure probably does keep release cadence steady, and that does smooth fundamental volatility.
Where I'd push back
The argument is that the market keeps getting this wrong because most participants aren't believers and extrapolate linearly. The consensus numbers say the opposite. The market is already extrapolating, aggressively, on the spending side.
FY27 consensus revisions over the last 12 months:
GOOGL capex +215% / revenue +30%
AMZN capex +105% / revenue +10%
MSFT capex +93% / revenue +6%
META capex +89% / revenue +17%
ORCL capex +85% / revenue +8%
No name has revenue revisions within 50pp of its capex revisions.
You could argue some of that is new analysts initiating with higher numbers, and coverage did grow at GOOGL and AMZN. But MSFT and ORCL have stable analyst panels and still show roughly +90% capex against +7% revenue. The gap is structural.
Why the headline numbers flatter the picture
1. Capex is understated. Combined FY27E capex is ~$1.1T, roughly 47% of revenue, up from ~16% in 2024. That's on consensus cash capex, which excludes finance leases. Estimates puts MSFT's lease-inclusive CY27 spend ~$26B above consensus.
2. Depreciation hasn't arrived. 2027E D&A for the group is only ~27% of 2027E capex. Estimates expect group depreciation to roughly quadruple by 2030 from ~$103B in 2025. Most of this spend hasn't hit the P&L yet.
3. Book lives may be generous. Most of the group depreciates servers over 5–6 years, and most extended those lives recently. Amazon went the other way, cutting from 6 to 5 years, citing the pace of AI hardware change.
The best counter to point 3 is that AWS says it has never retired an A100. Fair, but physical life isn't pricing life. A GPU still running at a fraction of its original rental rate is not the asset that was underwritten.
What would change my mind
Revenue revisions starting to close the gap on capex revisions. GPU rental pricing holding up as new generations ship. Either would make the convexity argument much stronger.
The bottom line
If you're right that smarter models override adoption bottlenecks, the labs win. That doesn't automatically mean compute owners win. In every infrastructure buildout, demand turned out to be real, and returns still went to whoever had pricing power, not whoever built the most capacity.
The market isn't short on believers. It's already pricing in the spend. The convex bet isn't compute broadly. It's finding who keeps pricing power once the capacity arrives.

Most people worry that enterprise inertia will result in a slower ramp of lab monetization which will cause an oversupply of compute and an inability to achieve an ROI on expected capex.
Because I believe smarter models override human bottlenecks my concern is instead that safety concerns force the labs to take their time with releasing new models and that credit will dry up in the interim.
The reason why I’m not overwhelming concerned by this is because imho safety is inherently bound by the realism of capital markets.
If you’re Dario as much as you pay lip service to the notion that you will sacrifice financials for safety the truth is that if you let Ant or possibly even OAI go bankrupt you risk a dispersion of that talent and compute in a manner that increases p(doom) substantially as you lose the oversight of a central governing mechanism.
So labs are going to play the delicate game of releasing models that are close enough to aligned but not procrastinate because they need to ensure they survive long enough to be the responsible stewards of ASI they aspire to be.
That means that vol gets somewhat smoothed out between model releases.
And again because the delta between models available to the public vs what the labs have internally has widened over the last year the other major source of exogenous risk (scaling laws faltering) has effectively been taken off the table.
TBC market vol will continue because most market participants are not believers and therefore consistently linearly extrapolate but from a “fundamentals” standpoint I view being long the value of compute as incredibly convex.
Two books I keep coming back to, neither of them about investing.
Loonshots, by Safi Bahcall, argues that whether a company can keep backing odd, early ideas depends less on culture than on structure. As organisations grow, incentives drift toward rank and politics and away from results, and the ability to nurture new things quietly fades. For us, that shifts the question from what management says about innovation to how the business is actually organised and paid. Bahcall's idea of the "false fail" is also useful: a good idea that looks dead because of a flawed early test. Some of the more interesting setups sit there, in businesses or products the market has dismissed on thin evidence.
Range, by David Epstein, separates "kind" learning environments, where feedback is fast and clear, from "wicked" ones, where it is slow, noisy and often misleading. Markets are firmly the second kind. That makes a case for breadth: a wide stock of reference points tends to travel further than deep pattern-matching in a single sector. The habit we take from it is to ask what a company resembles outside its own industry. The most useful analogy is often in a different sector, or a different decade.
Neither book gives a formula. Both are good at sharpening the questions. Highly recommend both to anyone that wants a good read/trying to sharpen their toolkit.
Fincantieri (FCT IM) screened as the best setup on my list: down 47% from the high, EPS estimates up 23% in 3 months. Running it through my one-pager, the picture is more nuanced. Walk-through below.
Market cap €4.4bn on 358mm shares. EV about €6.35bn, using net debt as gross debt minus cash, plus roughly €600mm for the four underwater acquisitions announced in July.
What the screen flattered
Revisions. FY26 EPS is +23% over 3 months, but FY26 EBITDA consensus is flat. About half the upgrade is a one-off €23mm gain on the China JV stake; most of the rest is lower interest. FY27 is cleaner, with EBITDA +4%.
Valuation. The "36% P/E discount" uses a 5-year average distorted by the 2023 loss. On FY27 EV/EBITDA it's 6.9x vs. a 7.3x 5-year average, only 5% cheaper. The real discount is about 33% vs. defence peers at ~10.3x.
Leverage. The headline 1.0x is at 30 June, before the July deals. Pro forma it's 1.9x on the company's definition or 2.75x gross debt minus cash. That's before €891mm of supplier finance and up to ~€400mm more deal commitments.
FCF. Thin: 1.8% yield for FY26 and 3.1% for FY27, as capex nearly doubles.
What looks good
Firm backlog €43bn, about 4.7x revenue. The headline €73.9bn includes €30.9bn of soft backlog (options, letters of intent).
H1 EBITDA +12.5%, margin up to 7.6%.
Cruise orderbook running to 2039.
Catalysts
Portugal: 3 FREMM EVO frigates, ~€3.9bn. Government agreement signed in July; industrial contract pending.
Belgium: frigate decision due by year-end, with FREMM EVO reportedly favoured.
US Navy: initial work on 4 landing ships, with construction possibly starting in Q4 and up to 35 ships planned.
9M results on 12 November.
Scenarios (FY27 adj. EPS × P/E)
Bull €19.40 (+58%, 30%): defence orders land. Street-high €0.88 × 22x, still below defence peers on EV/EBITDA.
Base €13.90 (+13%, 45%): consensus €0.77 × 18x, back to the 5-year average EV/EBITDA.
Bear €8.10 (–34%, 25%): orders slip, integration and leverage bite. Street-low €0.58 × 14x.
Probability-weighted: ~€14.10, +15%.
Risk/reward
Bull ÷ bear: 1.7x. Probability-weighted: 2.8x, which crosses 3x at about €12.05. Bull ÷ bear needs about €10.90 to reach 3x.
Thanks to a reply on my last post, I now show both. Bull ÷ bear shows the raw range; probability-weighted puts the base case and my conviction into the number. When they diverge this much, as they do here, the answer depends heavily on your probabilities.
Verdict
A real defence re-rating option with concrete near-term catalysts, but the screen flattered it. It's the closest to 3x of the names I've run so far, but only on the probability-weighted measure. Watching Belgium and the 12 November print.


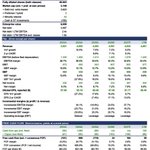
I use a simple one-pager to find interesting setups in equities. Same template every time, so names are easy to compare. Here's the framework, then a walk-through on Sixt.
The one-pager
Cap table. Price, diluted shares, market cap, net debt, EV.
P&L. Revenue, EBITDA, EBIT, EPS with YoY and 2-year growth, margins, and incremental margins.
FCF. FCF, FCF per share, FCF yield.
Estimate revisions. Consensus EPS vs. 1, 3, 6 and 12 months ago. Direction of revisions matters more than the level.
Valuation. P/E, EV/EBITDA, EV/Sales vs. the stock's own 5-year range.
Risk/reward grid. Bull, base and bear targets, then the R/R multiple (upside to bull ÷ downside to bear).
Checklist. Revisions up, multiple below history, growth accelerating, operating leverage, FCF yield above hurdle, R/R ≥ 3x. Score out of 7.
Walk-through: Sixt (SIX2 GY)
P&L. Revenue goes from €4.28bn (2025) to €4.59bn (2026E) to €4.84bn (2027E). EBT, the metric Sixt guides on, goes from €401m to €464m to €506m, taking margin from 9.4% to about 10.4%. Incremental EBT margin is about 21% in 2026, double the current margin. In H1 2026, EBT was +39% on +9% revenue.
Revisions. 2026 EPS is +2% over 3 months and +4% over 6 months, with 6 up and 1 down. But it's still –8% vs. 12 months ago. This is a recovery from a reset, not a fresh upgrade cycle.
Valuation. 10.2x 2026 and 9.3x 2027 P/E, vs. a 12.7x 5-year forward average. EV/EBITDA of 4.5x looks cheap, but it flatters every rental company because fleet depreciation sits below EBITDA. I lean on P/E and EBT.
Tailwinds: Sixt is taking share while Avis shrinks its fleet, industry capacity discipline supports pricing, fleet costs are easing, and the dividend yields about 5%.
Headwinds: jet fuel at around $140 is hitting airport travel, used-car values are rolling over in both Europe and the US (the 2024 margin hit was a residual value story), there was a Fed hike, the US consumer is weak, and consensus already sits at the top of 2026 guidance.
Scenarios (2027 EPS × P/E).
Bull, €119 (+64%): €8.80 EPS, 11.5% EBT margin, 13.5x.
Base, €89 (+24%): consensus €7.77 EPS at 11.5x.
Bear, €47 (–34%): a 2024-style margin reset to 8.4%, €5.93 EPS at 8x.
Probability-weighted (20/50/30): about €83, or +14%.
R/R grid. At €72.25, R/R is about 1.9x. It crosses 3x around €65.
Score: 5/7. Revisions positive, cheap vs. history, growth accelerating, operating leverage. Fails on FCF yield and R/R.
Verdict. Good company, cheap multiple, real operating leverage, but at today's price you're not paid 3x for the macro risk. I'm watching for the mid-to-low €60s, or a Q3 print that shows margins holding despite fuel and residual values.
Not investment advice. Just how I think through a setup.


Good framework. A couple of things I'd add.
First, some of the calm in the secured layer comes from how it's held. Much of the GPU-backed financing sits in private delayed-draw facilities that don't trade daily, so it doesn't show up as a price move the way public unsecured bonds do. That doesn't mean those lenders are worried. It just means the unsecured bonds are carrying most of the visible price discovery for the whole capital structure.
Second, the 15% on the unsecured makes sense once you look at the order of repayment. If the most valuable collateral is already pledged to the secured lenders, unsecured holders effectively have a claim on what's left after those loans are repaid. So that yield is less a judgment on whether the GPUs work and more a judgment on how much value remains after the secured layer is paid.
The thing I'd watch for the secured side is the gap between contract length and the useful economic life of the chips. As long as the contracts run longer than it takes the hardware to lose its pricing power, the structure holds up well. The point to watch is the next round of renewals, when current-generation capacity gets repriced against whatever comes next.

CoreWeave's debt, explained simply, because I like to speak plainly:
Secured debt = the mortgage. Backed by the house. The GPUs and the contracts they serve are the collateral.
Unsecured debt = the credit card.
Backed by a promise.
Everyone is panicking that $CRWV UNSECURED yield to MATURITY hit 15%
But a credit card rate spiking doesn't mean the house (or in this case the GPUs/data centers) lost value.
The secured lenders or the ones who underwrote the actual GPUs and contracts aren't selling here.
Now zoom out, because this is analogous to the entire AI market in wrapped up in a single company.
Trillions in secured, asset-backed debt are loaned against GPUs, data centers, power contracts, and signed capacity deals with hyperscalers. This money doesn't care about stock prices or investor sentiment.
It gets paid if the contracts pay. (Sounds pretty similar to $next if you ask me…)
Below that in line is unsecured debt, a bet on the companies themselves.
On top of everything is the equity, a bet on the story.
So when you see scary headlines about "AI debt," ask one question: which layer?
Yields spiking on unsecured debt and equities dropping while secured debt sits calm simply means the market is repricing the story.
The assets are fine.
The buildout keeps getting funded because the secured debt holders still believes in the collateral.
The day that changes… well the day secured lenders start questioning GPU values and contract quality, is the day the AI trade actually breaks and we should run for the hills.
Until then, volatility at the top of the stack (unsecured, equities) is just the shock absorbers doing their job.
Some notes on $CRWV's capital structure, from public filings and market data as of Oct 16:
DDTLs were ~38% of gross debt at 6/30 (~$13.6B of ~$35.6B). The rest was unsecured notes (~$10B), converts (~$6.6B) and OEM financing (~$5.1B). DDTL pricing has tightened over time, but much of that reflects the customer contracts behind each facility. DDTL 5.5 also priced wider than initial talk in August.
The unsecured notes trade in the low-to-mid 80s, yielding roughly 14–15%. Spreads on the 2032s have roughly doubled since June. Equity is still worth about $34B, so credit and equity are currently pricing the company quite differently.
The converts are 35–45% out of the money. A rough model puts their implied vol around 60–64%, versus ~72–75% on the longest listed options. Maturity differences and model choice could explain some or all of that gap.
The unsecured notes trade in the low-to-mid 80s, yielding roughly 14–15%. Spreads on the 2032s have roughly doubled since June. Equity is still worth about $34B, so credit and equity are currently pricing the company quite differently.
The unsecured notes trade in the low-to-mid 80s, yielding roughly 14–15%. Spreads on the 2032s have roughly doubled since June. Equity is still worth about $34B, so credit and equity are currently pricing the company quite differently.
The converts are 35–45% out of the money. A rough model puts their implied vol around 60–64%, versus ~72–75% on the longest listed options. Maturity differences and model choice could explain some or all of that gap.
If the gap holds up under a proper credit-adjusted model, one way to express it would be long the converts, short stock against them, and short senior notes as a credit hedge. The notes and converts rank equally, so they should recover the same in a default. The main risks are sizing the hedges correctly, borrow availability, and a sharp move in either direction.
The market implies roughly 15% odds of default within a year and 55–60% over 5 years, based on the senior note spreads.
The implied vols that match today's prices are about 60% for the 2031, 64% for the 2032 and 60% for the 2033, in line with my earlier estimates.
Not meant to be investment advice, just find it an interesting idea

One of the more interesting developments I’m seeing in how AI is being applied to investing is the emergence of the “one brain” concept. Essentially, building a system that can ingest and retain everything that goes into an investment process, from scribbled notes and Excel models to expert calls, management meetings, alt data, consensus revisions, macro developments and your own historical observations.
What interests me is less the ability to retrieve or summarise this information, but the possibility of continuously building and updating the mosaic. Every new datapoint should be assessed against the existing thesis, prior assumptions and what is already priced in. Is it genuinely new information? Does it change the earnings trajectory, the distribution of outcomes or the risk/reward? Does it reinforce an existing view or challenge it?
In theory, you could get to a point where the system maintains a live investment view, including a confidence level based on the underlying evidence, its reliability and how independent the various signals actually are. Importantly, you’d also have a record of how that conviction evolved, which datapoints were responsible and where your original underwriting proved right or wrong.
Given the complexity and sheer variety of inputs involved, I'm increasingly thinking the right architecture for something like this is some form of data lake/lakehouse, with Python sitting across it as the analytical and orchestration layer. Ideally, you'd have one persistent research environment that can accommodate structured financial data, unstructured notes, historical model versions and a record of how your investment assumptions have evolved. You could then have different AI models interrogating the same underlying research base rather than constantly rebuilding context from scratch. The real challenge, I suspect, will be less about warehousing the information and more about maintaining the relationships between the evidence, the underlying assumptions and the eventual investment decision.
I think there’s a lot of value in this, particularly given how fragmented most investment research processes still are. So much information gets lost in notebooks, old models, meeting notes or simply forgotten over time. Equally, we’re all susceptible to selectively remembering the evidence that supports our existing thesis.
I’m not particularly interested in AI telling me what stock to buy. I’m much more interested in whether it can help build a more complete, consistent and self-critical investment process, where accumulated knowledge actually compounds rather than repeatedly starting from scratch.
@JaredKubin @FundamentEdge curious how you both think about the architecture for something like this? Does a lakehouse/Python approach make sense, or do you see a better way of building a persistent investment memory that can actually feed into the decision-making process?
I’ve been thinking about where AI actually becomes useful in the investment process, and I think there’s a distinction between automating work and genuinely improving the quality of research.
A lot of the obvious applications are fairly straightforward. Pre-quarter summaries, earnings analysis, model updates, maintaining databooks, tracking consensus revisions. All things that should increasingly happen in the background. They save time, but I’m not convinced they represent much of a lasting advantage when everyone will eventually have access to similar tools.
Where I think it gets more interesting is having a system that retains context and continuously revisits your assumptions as new information comes in.
Take the setup into earnings. Ideally, the model should already know your original thesis, previous notes, management guidance, historical base rates, how consensus has evolved throughout the quarter and what the underlying growth trajectory looks like.
On earnings day, I’d want the system to tell me what has actually changed relative to those prior expectations, rather than simply summarising the release. What surprised us? Which assumptions were wrong? Does the new information change the forward earnings trajectory or the original investment thesis?
I think you can take this considerably further with historical data.
Every time a new data point enters a databook, the system should be able to recalculate the relevant historical relationships and tell you whether anything meaningful has changed. How unusual is the observation relative to history? Is it outside the normal seasonal range? Has its correlation with revenue or another operating KPI changed? Does it strengthen or weaken an existing leading indicator?
You could build a fairly interesting library of company-specific relationships this way, continuously updating as new information becomes available.
The more differentiated opportunity, though, is probably outside the standard quarterly workflow altogether.
I think there’s a lot of potential in building highly specialised research agents around individual companies or subsectors, particularly where the relevant data is fragmented, difficult to structure or not readily available through conventional financial data providers.
For example, combining supply-chain information, industry capacity, inventory, pricing, customer behaviour and competitor disclosures to understand a business at a more granular level. Or identifying which alternative datasets have historically been useful in anticipating changes in the underlying fundamentals, and continuously testing whether those relationships still hold.
A good analyst might have a handful of these relationships in their head, developed through years of covering an industry. The interesting possibility is being able to codify that knowledge, test it much more systematically and apply it across a far larger set of observations than would be practical manually.
There’s also a feedback loop that I think is underappreciated. The system should be able to look back at your historical assumptions and identify where you consistently got things right or wrong, which signals were useful and which relationships stopped working.
None of this removes the need to understand the businesses. In fact, the quality of the questions you ask and the economic intuition behind them probably become more important.
My sense is that most of the shorter-term earnings and modelling workflow will eventually be commoditised. That’s fine, and we should automate as much of it as possible.
But I’d be much more interested in using the time saved to build specialised systems that help answer difficult fundamental questions, continuously challenge existing assumptions and make deeper research possible at a scale that previously wasn’t economical.
That’s where I suspect the more durable value will be.
uncoveredalpha retweeted

I honestly don’t know I would stay even close to up to speed on AI without my X timeline. lately, I feel like if I step away for even a few hours, I’m behind!
Thanks to all who contribute.
If you are trying to build your timeline, I asked my Grok Bot to recommend 50 people to follow. If you were excluded, blame Grok!
Please include any great follows I missed in the replies.
Learn AI
@karpathy: clearest explainer of how LLMs work
@emollick: practical research on AI at work
@levie: AI agents in big companies
@omarsar0: daily paper and agent breakdowns
@HamelHusain: evals, how to tell if AI output is good
@danshipper: hands-on model and workflow reviews
@every: AI newsletter and tools
@bcherny: created Claude Code
@trq212: Claude Code usage tips
@claudeai: Anthropic product updates
@ClaudeDevs: building with Claude
@mattpocockuk: coding with AI
@Yuchenj_UW: AI systems and model news
@petergostev: compares model capabilities
@DanielMiessler: personal AI systems
@mstockton: practical LLM posts, low noise
@omooretweets: which AI consumer apps work
@lennysan: podcast with AI builders
@a16z: AI market maps
@paul_cal: balanced AI and ML commentary
@brijones: AI in Excel
@matanSF: agents that write software
@vasuman: rolling out agents inside companies
@itsolelehmann: AI use cases for business owners
@coreyganim: AI ROI for non-technical operators
Great post, Brett! This is something we’re thinking about as we build out AI at our fund. The flight school analogy really resonates.
For me, the aim isn’t just to produce the same research faster. It’s to spend less time assembling information and more time working out what matters, what the market already understands and where we might be wrong.
But that creates a training problem: an experienced analyst can challenge a polished AI answer because they’ve done the work themselves. A junior may not yet know where to push back.
That’s where I think your simulator idea gets interesting. I’d want to give someone a company at a particular point in time, with only the information available then, and make them commit to a view. What matters in the next results? What would change your mind? What would you ask management?
Then reveal the next piece of information and make them reassess.
I’d also deliberately put mistakes into the AI’s work: a plausible but wrong accounting treatment, an extrapolation that misses a change in the business, or a compelling thesis that’s already in the price. Can the analyst spot it and explain why it matters?
The important bit would be reviewing the reasoning, not just whether the stock went up. You can get paid for a bad decision and lose money on a sensible one.
I don’t think we need to preserve every bit of grunt work. We do need to preserve the habit of checking, questioning and taking ownership of a view. Otherwise we risk training people who can operate the cockpit but can’t tell when the instruments are wrong.
@FundamentEdge

I run a training firm and we primarily teach young investors how to be good fundamental equity analysts. We are really good at it, and have trained over 2,000 analysts and have done direct training engagements with dozens of asset managers (including many of the Top 100 funds).
Someone asked me the other day what I think my business looks like in three years.
We have always used the analogy of "driver's education for fundamental investing". We teach the style-agnostic fundamentals that don't exist in a university syllabus but you are expected to know when you hit the desk. What is soft guidance? What is an incremental margin and why does it matter? What am I listening for when I meet management? Our graduates come out of the Analyst Academy with a baseline level of fluency, which makes the "learning by osmosis" process (where the real value happens) a little smoother and less chaotic. Fundamentally, we activate their antennae.
I think that analogy is shifting to "flight school for fundamental investing". Firms are actively building the AI cockpit, designed with co-pilot and auto-pilot for certain parts of the process, and emerging analysts will have to learn how to press the right button at the right time to make the plane fly. I've used the Quant firm analogy: quants aren't updating cash flow statements by hand, but they are ideating, building the systems, monitoring the systems, and ultimately have accountability to the outcome. And quant firms employ thousands of humans.
And one of the hardest questions I get asked is "if juniors don't do the grunt work, how do they develop the skillset". This is a hard question, and I am super grateful to have eaten glass for 15 years as a fundamental investor to deeply know and feel what can be automated. But, just because we have always done it a certain way, does it mean that is the best way?
I have been playing with this idea of a simulation, from the flight simulator concept. You don't want a pilot learning with a live aircraft, so you train a pilot in a sim to build muscle memory. Can we do the same for investors?
Say you are a European banks PM and you are bringing a new junior onto your team. Can the sim ingest 30 years of European banks muscle memory? All the trades & macro driven moves and management successes and failures. You build 200 simulated real world situations, give them the fact partners, make them decide ("should I land the plane in a storm or divert to JFK?") while feeling the simulated effects of their decisions (also a great way in Academy to identify skill in a systematic way). As with a flight simulator, this experience builds muscle memory in a way that only happened by osmosis before.
It's really not that dissimilar to the data-buying / mercor RL sandbox environment boom happening now, but it's a systematic way to train humans. The big brain AI folks think we exceed human intelligence (and, some days, I buy that), but as a fairly spiritually connected person I've thought so long about the true source of intuition, that aha moment in the shower, that feeling that is deterministic to the outcome. PMs are driven more by gut feel than they will ever admit, and that is a GOOD thing, the sort of elusive nose for money may just be exceptional connection to the signals of the spiritual realm (I personally believe this to be true and hence my best ideas come when I'm in nature and connected). That doesn't persist when judgment is just a function of model weights.
Finding humans who have that, with the execution layer automated (co-pilot or autopilot), then muscle memory encoded in a simulator approach. Feels like the path forward for human in the loop investing.
A few observations in today’s AI/investment landscape:
1/ Watching a structural shift in how investment teams are built. My old fund already cut the analyst layer entirely, now a lean 3-PM structure supplemented by AI for qual and quant work. I suspect this becomes more common, not less.
2/ AI tools + years of experience let PMs get to quality insights faster than a traditional analyst-fed process. Token costs are trivial vs. a $300k analyst salary. The real cost shifts from headcount to the PM’s own time verifying and synthesizing AI output.
3/ If lean teams work, it should also lower the breakeven AUM to launch independently. A rising share of new fund launches are coming straight out of multi-manager platforms rather than from large, analyst-heavy shops.
4/ Though fewer analysts means a thinner bench for succession. The analyst layer wasn’t just idea generation, it was where the next CIO/senior PM would build a track record for a decade before anyone trusted them with the book.
5/ AI can’t easily replace that. Sizing up or down under pressure is a function of temperament and scar tissue. A 3-person pod with no bench has genuine key-man risk baked in, worth asking how funds structure key-person clauses when there’s no obvious “next” PM.
6/ Leaner teams probably mean more spinouts and faster idea-to-insight cycles, but LPs will need to get sharper on succession clarity and multi-tiered key-person triggers as the analyst-as-training-ground model disappears.
Would be interesting to hear @FundamentEdge thoughts, perhaps you are seeing different trends given you are closer to coal face around new analyst cohorts?
Jared’s put together a “what’s moving” dashboard — super helpful for context on broader themes and how the market’s thinking thematically, not just the day’s movers. Genuinely useful pre/live/post market, and it’s become a daily fixture on my commute into the office.
@JaredKubin

🚨 TOP & BOTTOM Movers 🚨
I always like checking the pre-market / live / post-market for the top/bottom movers. Now on mobile... its right at the top for immediate access for you
1. if you haven't followed the steps below for mobile ... add to your home screen... the experience is A+ 👇👇
2. always check "What's Moving Today" first
3. MOVERS is the new section up top - click on it ... it will tell you if we are in the pre - live - post session
4. Navigate between different views
5. Click on an individual stock to pull up a quick chart tear-sheet which we will add to over time
Let me know what else you want for the PRE - LIVE - POST for quick access on mobile
Something I’ve been sitting with lately, and figured I’d just put it out there.
I’ve been in equity research for almost 15 years now, both on the sell side and now buy side. Still love it — genuinely. That hasn’t changed.
But I’ve noticed something as I’ve aged into the role that I don’t see talked about much on here. A lot of fin twit skews young — aspiring analysts, people early in their career, folks without kids yet. And that’s great, that energy is part of what makes this space good. But it means there’s not a lot of conversation about what this job actually costs once you have a young family.
Five days a week in the office. Fully plugged into markets that don’t care about your daughter’s bedtime or her first steps. You do the job well precisely because you’re all in.
I find myself wondering, more than I expected to at this stage, whether I’m trading away years of my daughter’s early development that I don’t get back.
Not looking for answers exactly — more curious if there are others out there, further down this road, who’ve wrestled with the same thing.
How did you think about it? What did you change, if anything? Any regrets, either direction?
Just thinking out loud. I’ve seen @blueprintsmb22 talk about his transition. But would genuinely value hearing from anyone who’s been here.
AI is now very good at reading transcripts, filings and expert calls and turning them into long question lists for management. But the real edge isn’t just the content of the question – it’s how you frame it so management actually opens up.
I recently came across Ross O’ Toole’s book: Breaking the Script. The book makes an interesting point: “why” questions often trigger defensiveness, while “what” questions invite explanation and detail. Same topic, different reaction.
Instead of: “Why did margins miss last quarter?”
Try: “What were the main drivers behind the margin outcome last quarter, and which of those do you see as temporary vs structural?”
Instead of: “Why are you raising prices again?”
Try: “What changes in your cost base or mix are behind the latest price actions, and how are customers responding so far?”
The art here is getting management to talk in narratives and trade-offs, not just defend a number. AI can help you prepare, but the human skill of framing, tone and follow‑ups is what turns a scripted Q&A into a real conversation.
Breaking the Script is a great reminder that how you ask is often as important as what you ask. Highly recommend reading this book if you want to ask better and more thoughtful questions.
Almost every convo on X these days ends up at: “How are you using AI in your investment process?” Fair question. After a couple of years of actually using these tools on the buy side, the honest answer is more mundane than the marketing—and more useful for exactly that reason.
First, what AI is not doing for me.
It’s not picking stocks. It’s not sizing positions. It’s not deciding how much risk to run into a binary event, or whether a SOTP discount is real complexity or just neglect, or when a cheap stock is cheap for a reason.
Those aren’t clerical tasks at the end of the process; they are the process. Any firm outsourcing those to a model hasn’t removed risk; it’s just moved it somewhere less visible and harder to challenge.
What has changed is the cost of a first pass.
Reading a 40‑page initiation, a foundry capex note, or three years of audited financials used to burn pure analyst hours. Now the first read takes minutes. That doesn’t remove the need for careful reading; it just changes where scarce attention gets spent. If a tool can get you to the right sections faster, flag inconsistencies between a new disclosure and an old one, and frame the obvious questions before the deep work starts, the analyst spends more time on the second and third reads—where judgment actually lives.
Edge was never about knowing a signal exists; it’s about working out whether the signal matters, what’s already priced, and what could shift the distribution of outcomes. None of that has changed.
Monitoring works the same way.
A diversified global book throws off a constant stream of small signals: filing tweaks, options shifts, regulatory updates, local news that never hits the global feed. AI is genuinely good at flagging that something changed. It’s much less reliable at telling you whether the change is material. Confusing those two capabilities is how mistakes get made faster rather than avoided.
Uncomfortable truth: AI makes mediocre work look polished.
A clean summary can create the illusion of understanding. A confident paragraph can hide weak sourcing, stale data, or one bad assumption doing all the load‑bearing work. In this business, being approximately right for the wrong reason is often worse than being openly uncertain, because the wrong reason eventually catches up with you at size. So the process has to treat AI output as a draft, never as evidence. The burden of verification doesn’t disappear because the paragraph reads well.
Where the tools have surprised me on the upside is as a forcing function.
Asking a model to argue against a thesis, to identify the single assumption the whole idea rests on, or to list what’s missing from an analysis is cheap, fast, and occasionally uncomfortable in a productive way. It won’t catch everything a good analyst misses. But it raises the floor on preparation, and preparation is where most avoidable errors originate.
One structural risk is worth naming.
If most market participants end up running similar models on similar data, correlation risk can rise even while individual decision quality appears to improve. Regulators have started thinking out loud about what happens when automated systems all reach for the same trade at once. That isn’t a reason to avoid the technology; it’s a reason to be deliberate about where it sits. In my view, AI belongs near the front of the funnel—breadth, retrieval, speed. It doesn’t belong at the point of final judgment, where context, incentives, liquidity, sizing, and plain nerve matter most.
So the candid version of “how we use AI” is this:
It compresses research time, improves monitoring, gets us to the right questions faster, and makes the first draft of almost anything much cheaper. It does not create conviction, it does not know when the market is missing something, and it does not carry the consequences of being wrong.
The firms that get hurt by this technology won’t necessarily be the ones that ignored it.
@FundamentEdge
Everyone aspiring investor should read this twice.
This logic is the exact reason I own $HOG. The share price is up ~11% since I purchased the shares a month ago. And it is still trading well below intrinsic value if you do the work and correctly calculate the enterprise value. Opportunities like these are available, but only if you anchor your investment process to price first. $HOG is a great example of a business that by consensus estimates lacks a “moat” yet it was and still is trading well below true intrinsic value

There is a generation of investors, now in their twenties and thirties, who have been so thoroughly brainwashed by the word “moat” that they have, in a precise structural sense, lost the ability to recognize a cheap stock when one is sitting in front of them, because the word has been wielded, in interviews and podcasts and annual letters and Twitter threads, with such relentless authority for the last 25 years that it has crowded out the older, simpler, more durable investing concept that built every fortune in the history of the discipline before the moat-industrial complex was invented, which is the concept of price.
Price is the actual edge. Price has always been the actual edge. The entire history of compounded returns in equity investing, from Graham through Schloss through Ruane through the early Buffett through every quiet practitioner who never appeared on a podcast, was built on buying things for less than they were worth, and the question of whether the underlying business had a moat was, in the original framework, a secondary consideration that mattered only insofar as it affected the calculation of intrinsic value, not a primary lens through which every potential investment was filtered before the price was even examined.
The moat-brainwashed investor in 2026 will look at a profitable, debt-free, asset-rich small-cap company trading at 3x earnings and dismiss it in a single sentence, because the business “lacks a moat,” and he will then turn around and buy a software platform at 80x revenue because it “has a moat,” and the moat will turn out, in 36 months, to have been a marketing slogan attached to a business model that the market had already decided was going to deteriorate, and the 3x earnings company, which never had a moat and was never going to have a moat, will compound quietly at 14% a year for the rest of his life while he is busy explaining to his friends why his moat thesis was actually correct in spirit and just wrong in price.
The most expensive lesson in modern equity investing, the lesson that has been paid for in real money by an entire generation of educated, well-read, intellectually serious young people who genuinely believed they were doing the work, is that a moat at the wrong price is worse than no moat at the right price, and that the entire late-Buffett framework that produced this confusion was a personal philosophy developed by a specific man, with a specific tax situation, deploying a specific amount of capital that prevented him from running the original Graham strategy that had actually built his fortune, and that the canonization of his late-stage approach has, for 25 years, been actively harmful to ordinary investors who do not have his constraints and who would, in almost every case, be better off doing what he did when he was their age, which was buying small, cheap, unloved, unfashionable companies at fractions of their underlying value, and ignoring the moat question entirely until the price question had already been answered.
You can do this. You can run the original strategy. You can buy the cheap stocks the moat-brainwashed investor will not touch, at prices he refuses to consider, in a basket sized appropriately, held patiently, while he is busy paying 80x revenue for a story that will not survive its next earnings call. The price will save you. The price has always saved every investor who paid attention to it. The moat is not the edge. The moat was never the edge. Price is the edge, and price is sitting there, in 2026, in dozens of unloved, unfashionable, ignored small-cap names that an entire generation of investors has been trained to walk past, which is, as it has always been, the entire reason the trade still works for the small minority of investors who never accepted the brainwashing in the first place.
Excellent summary and insights into why $BROS sold off despite headline beats.
I always think as an investor you need to think about positioning/sentiment as much as the quality of the underlying fundamentals. Headline beats don’t always translate into strong stock performance. Expectations matter.
I would encourage everyone to think about positioning into the print. Short interest changes, volume traded into the print, estimate revisions etc. one thing that is a bit harder to judge but critical is the buy side whisper. We all see the sell side consensus KPIs for the next Q. But if the buy side whisper is what really matters most in terms of how the stock trades on the day

Good question why Dutch Bros $BROS fell....4 things stick out at me:
1) The stock had already rallied ~13% into the print. "Beat and raise" was largely priced in, so longs sold the news
2) At 90x PE, you're paying for acceleration. Q1 was 8.3% comp, Q2 guide is "approaching 5%" ....that's a deceleration, even though it still beats consensus. High multiple stocks rerate fast on trajectory shifts
3) The back half gets harder: ~100bps of price rolls off in Q3, coffee cost pressure peaks in 2H, and the comp comparisons get tougher (Q4 2025 was +9.5%). The math gets worse before it gets better
4) Macro tape: investors are deleveraging out of high multiple growth for safety. BROS has a beta around 2.5 .... it gets sold first in a derisk move, regardless of fundamentals
Bottom line: a great quarter from the company doesn't always equal a great day for the stock. When positioning unwinds in a hostile tape, even good prints get sold. (see my $CAVA reference why I love the company but can't buy before earnings on a 150x PE after seeing bombs explode).
Opportunity: these moves create watch list opportunities...the fundamentals didn't change, the price did....wait for the timing to add risk back at cheaper prices