

emerging market equities, data driven, f1 fan
Mumbai
Joined April 2009
- Tweets3.9K
- Following300
- Followers8.4K
- Likes6.1K





Americans love Asian equities and Asians love US equities
US resident investor holding of Asian equities has now reached record high of USD 4.4 trillion rising by USD 1.4 trillion over the last one year. Valuation gains have helped but also fresh flows of USD 103 billion over the last year, 52 billion over the last six months and 34 billion over the last three months.
US investors in Asia are heavily skewed towards Korea, Japan and Taiwan accounting for 75% of their holdings. Higher weight of these countries in the Asian/global indices and the need for tech exposure driving this skew. China and India, the larger economies losing out.
On the other hand Asian investors continue to buy US equities. They have bought USD 311 billion of US equities over the last year taking the total Asian holdings of US equities to USD 4.6 trillion.
5
935
The International Energy Agency (IEA) says renewable energy to overtake coal as the largest supplier electricity in 2026. A major milestone!!
Renewables to grow by 8% vs 2025. Solar PV to be the largest contributor to the supply growth and will overtake wind as the 2nd largest renewable source. Largest being Hydro by a large margin.
On the other hand, growth in electricity demand will rise to 3.6% in 2026 and 3.8% in 2027 from 3% in 2025. Incrementally driven by data centers and EVs.
China's Dominance of Global Manufacturing
Since the year 2000, annual global industrial production growth has averaged 3.3%. China's industrial production growth well above at 10% per year. Excluding China, rest of the world has seen an annual industrial production growth of only 1.5%.
China now accounts for 30% of global manufacturing up from 6% in 2000. And accounts for 21% of global manufactured exports up from 5% in 2000.
China's produced 34.5 million motor vehicles in 2025 up from about 2 million in 2000. Excluding China, vehicles production by RoW has been flat for 25-years. China's vehicles exports have risen from 1mn units in 2020 to almost 10mn units now.
2
309
% of Workforce Employed in Agriculture
India 🇮🇳 42
Pakistan 🇵🇰 36
Indonesia 🇮🇩 27
China 🇨🇳 22
Mexico 🇲🇽 11
Brazil 🇧🇷 7.6
South Africa 🇿🇦 5.4
Russia 🇷🇺 5.1
South Korea 🇰🇷 5.1
Japan 🇯🇵 2.8
France 🇫🇷 2.3
Australia 🇦🇺 2.2
USA 🇺🇸 1.5
Germany 🇩🇪 1.1
UK 🇬🇧 0.9
4
340
Your AI queries cost a lot
Global data centers consumed over 450 Twh of electricity in 2025, about 2% of total global electricity demand. Electricity consumption by AI focussed data centers surged 50% in 2025.
For cooling those data centers water is needed. A 100MW hyperscaler data center in the US consumes about 2 million litres of water per day. Equivalent to the needs of 6,500 households.
3
332
The 5 largest military spenders: US, China, Russia, Germany and India collectively make 60% of the US$ 2.7 trillion of global defense expenditure. The top-10 make 73% of the total.
Russia, Saudi and Ukraine being outliers spending 7.1%, 7.3% and 34.5% of their GDP in military expenditure.

8
492
India's defense exports are up 50x in the past 10-years rising to Rs 384 billion in FY26.
Yet India does not feature in the worlds top 25 global arms exporters. Here is the global share of exports of major arms:
US: 43%
France: 9%
Russia: 8%
China: 6%
Germany: 5%
Italy: 5%
UK: 4%
Isreal: 3%
Spain: 3%
South Korea: 2%
Others: 12%
South Korean Market Volatility has been Extreme
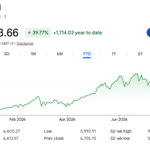
- KOSPI is down 34% from the all time high hit on 22nd June 2026. But still up 40% YTD in 2026.
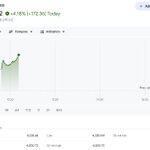
- KOSPI was down 10.8% today. 2nd largest one day move in over 10-years.
- 7 of the 10 largest one day index moves over the last decade have happened since March of this year.
- 15 of the 20 such moves in 2026.
- And 3 of the largest 4 one day moves in the last 5 weeks.

China's progress in global tech leadership is remarkable
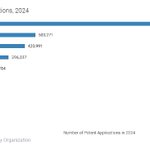
1) China files more patents than the next 9 countries combined. 3.6x of US, 4.3x of Japan, 24x of India.
2) China's share of top 10% most cited publications rose from 5% in 2005 to 47% in 2025. Share of US fell from 40% to 9%.
3) China has overtaken US in gross R&D spending on PPP basis. Real R&D spending in China grew at 12% CAGR since 2004 over 3x of the US pace.


About 14 million people or 1% of India's population hold a gym or fitness center membership. Significantly lower than 25% in the US, 8% in Brazil and 5.5% in China.
12% of the gym market in India is in organised format.
The top 4 cities (Mumbai, Delhi, Bengaluru, Hyderabad) account for about 40% of the gym market and the next 6 cities another 15%.
Female participation well lower than male participation at an estimated 25% of total memberships.
5
910
Semiconductor stocks now account for 12% of global market cap, up from 2.7% in 2022.
Energy stocks (oil + gas) now account for only 5% of global market cap.
Semis have accounted for 55%, 50% and 40% of the 2026 market returns in Emerging markets, US and Japan respectively.
The weight of TSMC the largest stock in the MSCI Emerging market index stands at 14.8%, much bigger than India's weight at 10.8%.
Followed by Samsung Electronics and SK Hynix, 2nd and 3rd in the EM index with weights of 9.3% and 6.9% respectively.
Just to put these numbers into context, the weight of HDFC bank, India's largest stock in the EM index has a weight of just 0.7%.
2
414
The wealth effect created by just two companies in South Korea is staggering
Samsung Electronics and SK Hynix paid out $22billion in 2025 to their domestic employees. Which is 1.2% of Korean GDP.
Their labour agreement allocates about 10% of operating profits as performance bonus to employees.
The combined payout from Samsung and Hynix to their employees is expected to rise to $34bn in 2026 and $46bn in 2027. Thats 1.8% and 2.5% of GDP respectively.
India's R&D Problem
Aggregate spending by NSE 500 companies on Research & Development (R&D) amounted to just 0.8% of their aggregate revenue.
This is less than half of the Emerging Markets average of 2%. Way lesser than developed markets where US is at 10%, Europe at 4.6% and Japan at 3%.
43 global listed companies individually spent more on R&D than the 6 billion dollars spent per year by India's top 500 listed companies put together.
The amount Indian companies spend on R&D in a year is less than what US tech giants like Amazon, Google and Meta spend in a month.


Taiwan and Korea now have a weight of 50% in the Emerging Markets Equity Index. While their share in EM GDP is just 7%.
China and India now account for only 28% of the Emerging Markets Equity Index. While their share in EM GDP is 60%.
Such has been the performance of just 3 stocks driven by the AI theme: TSMC, Samsung Electronics and SK Hynix.
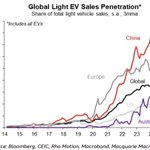
Electric vehicle car sales exceeded 20 million in 2025. Annual global car market is about 80 million, which means 25% of new car sales globally are now electric.
China is by far the largest EV manufacturing hub with 75% of global car production. 53% of new cars sold in China or 13 million are now EVs.
Europe is the 2nd largest market with 4.3 million EV sales or 27% of total. Among other large car markets US, Japan and India lagging behind.
Global EV fleet however remains small in stock term at only 5% equivalent to roughly 1.2 million barrels per day of reduced oil demand.
Norway remains the global leader in terms of penetration with EVs accounting for 97% of new car sales.
And guess what, Nepal comes 2nd at 68%

There are 15 companies in the world with a market cap of over $ 1 trillion.
Samsung Electronics, SK Hynix and Micron, all AI hardware names, joined the trillion $ club recently.
Off these 15 companies 11 are in the U.S. The 4 names outside the U.S. are TSMC from Taiwan, Saudi Aramco from Saudi Arabia and Samsung, SK Hynix from South Korea.
Off these 15 companies 12 are in the technology sector.
The list in order of M-Cap
1) Nvidia
2) Alphabet (Google)
3) Apple
4) Microsoft
5) Amazon
6) Broadcom
7) TSMC
8) Saudi Aramco
9) Tesla
10) Meta
11) Samsung
12) SK Hynix
13) Berkshire Hathaway
14) Micron
15) Eli Lily
2
387
India is the world's largest remittance recipient at USD 140 billion. Thats about 4% of India's GDP. And 16% of global remittances, double of Mexico's share which is second.
About 15 million Indian nationals stay abroad sending those USD 140 billion back to India. Off that 15 million people about 10 million or 2/3rd stay in Gulf countries. Gulf countries account for 1/3rd of India's total remittances at about 1.3% of GDP.
Kerala is India's largest remittance receiver with 2.2 million Keralites living abroad. Off which 90% reside in the Gulf.
There have been only two countries that retaliated and implemented countermeasures against the multiple US tariffs over the last 15-months.
Canada and China
1
339
Since 1st January 2025, leaders of government or state heads that have visited China are 27. To the US half the number at only 14.
Geopolitical shits are clear. US foreign policy uncertainty and China’s economic ascendancy both playing a part.
1
5
279
India's Mutual Fund Industry
- Assets under management of $800 billion growing at 20% CAGR in INR over the last 10 years
- 11.3% of total equity market capitalisation up from 4.3% a decade ago
- SIP flows currently stand at an annualised rate of $40 billion
- Comprises of 49 Asset Management Companies (AMCs). Top 3 AMCs manage over $100 bn each.
- Top 5/10 AMCs collectively account for 56%/76% of industry AUM (high concentration)
- Biggest AMCs ($ bn): SBI ($140), ICICI Pru ($121), HDFC ($104), Nippon ($79), Kotak Mahindra ($64)
- AUM breakdown by investor: Corporates 36%, HNI 36%, Retail 27%
- AUM by fund type: Debt 21%, Equity 43%, Hybrid 14%, Others 22%
- Top 5 most overweight names by mutual funds: Axis Bank, ICICI Bank, NTPC, Eternal, Kotak
- Top 5 most underweight names by mutual funds: Reliance, Vedanta, HDFC Bank, HUL, BSE
- Sector-wise active weight of mutual funds: Largest OW in Discretionary, Health Care and Financials. Largest UW in Energy, Materials and Staples.
5
602