

A national leader in transportation research. Studying new mobility, parking, public transit, traffic, and much more. (Rarely monitoring, find us on LinkedIn.)
- Tweets2.2K
- Following362
- Followers1.9K
- Likes1.2K







ALT A smiling student wearing a “UCLA Bruins” shirt and large earrings stands outdoors, with text on the image reading “Learn more at its.ucla.edu/prospective-students.” The UCLA Institute of Transportation Studies logo appears at the bottom.

ALT An illustration of a street scene features a pink sidewalk with large cracks in the foreground, looking down its length. On either side of the walkway are stylized green trees with various patterns such as dots and stripes. In the background are multi-story apartment buildings, and a clear sky with a cloud. At the top of the image is a pink speech bubble with the text "Sidewalking". Below that is a yellow banner that reads, "A toolkit for engaging youth in planning and designing urban mobility futures". In the bottom right corner is a blue box labeled "NAME" with the "cityLAB UCLA" logo and the text "September 2024".


ALT Graphic of an email envelope with an @ symbol and a notification badge promoting the UCLA Institute of Transportation Studies mailing list. Text reads: "Subscribe to the mailing list for the latest research, news & events from UCLA ITS" with the URL "its.ucla.edu/subscribe."


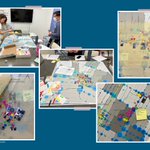
ALT A collage of five photographs titled "Thick mapping process photographs" captures a collaborative urban planning workshop. On the left, people gather around a large table covered in maps and markers. The central and right-hand photos display close-up views of the maps, heavily detailed with colorful stickers, drawn annotations, and handwritten sticky notes indicating community feedback or geographic data around local schools.

ALT A collage of six hand-drawn maps titled "Students' hand-drawn maps created during walking audit post-walk interviews." The four maps along the top row show detailed annotations, routes, and personal comments handwritten in various colors like blue, red, and orange over identical base maps of a neighborhood near Larchmont Charter School and Equitas Academy. The two larger maps at the bottom focus on specific paths, streets, and areas highlighted with green and blue lines, accompanied by handwritten notes describing personal safety perceptions and community landmarks.

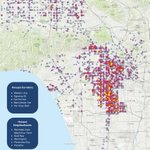
ALT Heat map of pedestrian and bicycle hit and runs (2015-2024), showing hot spots around Western Avenue, Figueroa, Central, Manchester, and Van Nuys Boulevard. The hotpost neighborhoods are Westlake, Skid Row, Wilmington, Panorama City, and Pacoima.

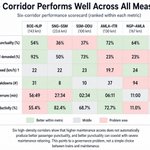
ALT Dashboard comparing six sampled corridors across passenger punctuality, maintenance block grants, freight speed, track breakdowns, block overruns, and block productivity. Green cells indicate relatively better performance, gray cells middle performance, and red cells problem areas, showing that no corridor performs well across all measures.

ALT A map showing the concentration of horse populations represented by brown bin locations in Council District Seven in the San Fernando Valley of Los Angeles. The map also labels neighborhood locations within the Council District boundary.

ALT Map of Los Angeles and Ventura County freeway segments grouped into three screening tiers. The map shows which freeway segments appear more or less structurally ready for further study based on market potential and implementation feasibility.
