

Cartographer & Visual storyteller | open for freelance projects | order a map
Joined September 2026
- Tweets88
- Following36
- Followers114
- Likes65




Bird migration maps have become popular, but what I see is that maps are showing simulated (fake) data by AI. No one cares about real gps tracks of birds…
14
Oldest still active universities for each country in Europe and transcontinental countries
Day 10 of mapping challenge - Prompt meant to be using only ai to make a map. Well, I took it opposite with the inspiration of the one post from LinkedIn and made it by myself

17
8️⃣ Day 8 - Perfect weather days in Europe | Utopia
🗺️ There is no precise definition of perfect weather; that's why today I want to count it.. And since this is my map, perfect day is also defined by me :)
ℹ️ Data: OSM, ERA5 & Copernicus
ℹ️ Tools: Python (Claude), QGIS, Figma

33


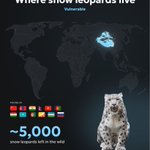
7️⃣ Day 7 - Snow Leopard habitat | 10-minute map
ℹ️ Data Sources: IUCN, Natural Earth Data
ℹ️ Tools used: QGIS, Figma
Photo: Eric Kilby · CC BY-SA 2.0 · Wikimedia Commons
#30DayMapChallenge
#hireme: Esri, Reuters, National Geographic, Statista :)

3
104
6️⃣ Day 6 - English settlements origins | Vintage
ℹ️ Data Sources: GeoNames, OSM, YT shorts Virginia Beowulf (info & idea)
ℹ️ Tools used: Python (with Claude), QGIS, Figma
Illustration generated in Google
#30DayMapChallenge #30DayMapChallenge2026

3
106
5️⃣Day 5 - Europe as seen from satellite | Sense: Sight
🗺 Some time ago, I made a visualization of a 12-month pie chart for Almaty city that showcases all the months/seasons in a pie view. This time, I took that idea and experimented with the whole country.
ℹ️ Data: OSM, MODIS
1
4
171


4️⃣Day 4 - Bird Migration | Clusters
Inspired by Esri Deutschland map Nature's flight plans
White stork by Moroccan spotter
Common crane by MinoZig
Montagu's harrier by Charles J. Sharp
Western marsh harrier by Charles J. Sharp
Lesser black-backed gull by Henriok
1
64
3️⃣Day 3 - Caspian Sea is drying | Polygons
ℹ️ Data Sources: The Times of Central Asia, Landsat, Sentinel, OSM, Euronews
ℹ️ Tools used: QGIS, Figma
#30DayMapChallenge #30DayMapChallenge2026 #map #cartography

1
138


