

Portfolio Manager Passionate about understanding businesses behind the numbers. I analyze market movements,
New York, USA
Joined November 2011
- Tweets4.9K
- Following236
- Followers4.3K
- Likes4.5K





$PCLA is up 26.13% at $12.26, but the intraday action has cooled after an early spike to $12.52. Price is now consolidating near the lower end of the range.
Key levels:
• Immediate support: $12.24–$12.26
• Major support: $12.14–$12.20
• First resistance: $12.32–$12.36
• Major resistance: $12.47–$12.52
Holding $12.24 keeps a rebound setup alive. Bulls need to reclaim $12.36 with volume before momentum turns stronger; losing $12.20 would increase downside risk. #PCLA #Stocks

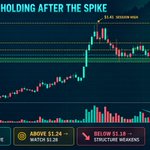
$NCPL is up 63%, but the real story is how it’s holding after the move.
The $1.41 spike got sold, and price is now consolidating near $1.21. I’m watching $1.18–$1.20 as support and $1.24 as the first level buyers need to reclaim.
Above $1.24, $1.28 is back in play. Lose $1.18 and the setup starts falling apart. Let the chart prove itself.

Nscale just filed to go public on the NYSE under $NSCL, and the headline number is hard to ignore: more than $103B in contracted value.
But here’s the number I’m watching:
Roughly 25K GPUs are operating today, while another 436K are still planned.
That doesn’t kill the story—it defines it.
Microsoft and Anthropic help prove the demand is real. Now Nscale has to secure the power, fund the buildout, deploy the hardware, and turn that massive backlog into actual revenue.
With $140.6M in first-half revenue against a $1.02B net loss, this IPO is less about demand and more about execution.
Big contracts get attention. Revenue conversion will decide whether the story holds up.
$NVDA $MSFT

Emily Carter retweeted

BREAKING: Interest costs on US public debt rose +$139 billion YoY in the first 11 months of FY2026, or +12%, to a record $1.27 trillion.
This represents ~26% of total US government receipts.
This also marks the 6th consecutive annual increase, totaling +$784 billion, or +162%.
Interest expense on federal debt is now on track to surpass $1.30 trillion in a full fiscal year for the first time in history.
In August alone, the US government spent $98 billion on interest, or $3.2 billion a day.
The US government needs lower rates more than anyone.




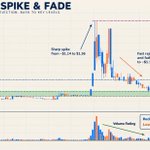
$TURB up over 100%, but that $3.78 wick shows how fast these moves can unwind.
It’s now trying to build a base around $1.60–$1.70. I’d want to see $1.95–$2.05 reclaimed with volume before getting interested again.
Lose $1.60 and I’m staying out. Don’t chase the headline.

$DCX up more than 200% after running from $0.27 to $1.14.
The trend is still strong, but this isn’t where I’d blindly chase. I’m watching $0.95–$1.00 as the key support area. If that holds, another test of $1.14 is possible.
Lose $0.95 and the setup gets a lot riskier. Protect the downside first.

$DCX up more than 200% after running from $0.27 to $1.14.
The trend is still strong, but this isn’t where I’d blindly chase. I’m watching $0.95–$1.00 as the key support area. If that holds, another test of $1.14 is possible.
Lose $0.95 and the setup gets a lot riskier. Protect the downside first.

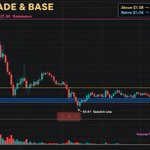
$TPST up 39%, but the chart tells a different story after the early spike.
It hit $1.34, gave back most of the move, and is now sitting near $1.05 on fading volume. I’m watching $1.04 for support and $1.08 for a reclaim.
Above $1.08, it may get another push. Below $1.04, I’m staying away.

$STAK squeezed to $1.36, then gave back most of the move as volume faded.
$1.16–$1.17 is the spot to watch now. If buyers hold it and reclaim $1.20, this could get another push. Lose $1.16 and I’m staying out.
No reason to chase—let the chart confirm.




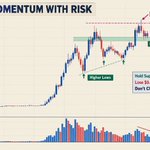
$ADBT is still up 30%, but the intraday chart tells a different story: lower highs, lower lows, and a sharp breakdown from the $0.131 area.
Price is now trying to build a base around $0.125–$0.126 after touching $0.1227.
Key levels:
• Support: $0.123–$0.125
• First resistance: $0.128
• Major reclaim zone: $0.131–$0.133
Bulls need to recover $0.128 with real volume before I trust a bounce. If $0.1227 breaks, another leg lower is on the table. Don’t let the headline gain hide the weakening price action.
$ADBT #Stocks #Trading

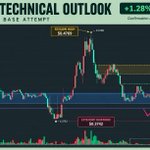
$PDSB is up 1.28% at $0.4042, but the real story is the failed spike to $0.4769. Sellers erased the entire move, and price is now building a tight base around $0.395–$0.405 as volume dries up.
Holding $0.395 keeps the stabilization attempt alive. A reclaim of $0.410–$0.418 could open $0.425–$0.437, while losing $0.390 puts the $0.3742 low back in play. Right now, confirmation matters more than anticipation.

Emily Carter retweeted

September is historically the market’s most difficult month, and this year we entered the period with another significant headwind: rising interest rates and oil prices. Yet the major averages held up relatively well in the face of a surge in both last week.
What we may be witnessing is more of a rotational correction and consolidation beneath the surface. The S&P 500 can appear relatively healthy while a large percentage of its individual components are already experiencing corrections.
The breadth statistics illustrate this divergence. As recently as mid-August, roughly 69% of S&P 500 stocks were above their 50-day moving averages. By September 11, that figure had fallen to roughly one-third of the index. On September 9 alone, 383 of the 500 S&P stocks were declining, while decliners outnumbered advancers by nearly 3-to-1 on the NYSE.
That's considerable internal deterioration without a comparable collapse in the headline index. In fact, from August 18 through September 8, the S&P 500 declined only about 0.2%, even as broader measures of participation deteriorated substantially.
We may already be experiencing a stealth correction—one stock and one group at a time.
With September historically the weakest month of the year, we still need to respect the seasonal risk, particularly with interest rates on the rise and elevated oil prices.
But if the indexes can hold together while individual stocks complete their corrections and begin rebuilding technically, the market could emerge from September in considerably better shape than the major averages alone would suggest, and the historical tendency then shifts to a strong year end rally.
The key is patience; to wait for proper setups and not let the indexes pressure you into sub standard trading decisions.
The real story right now may not be what the S&P 500 is doing. It's what the stocks beneath it have already done and are currenty doing.
We are seeing a very sharp rotation beneath the surface today, with the selling concentrated in the areas that have been at the center of the AI infrastructure trade. The Nasdaq opened down roughly 1.2%, but the damage is considerably worse across semiconductors and AI-related hardware. MRVL, MU and INTC were down roughly 6% or more early, LRCX was hit around 8%, and NVDA fell more than 3%. The weakness is global, with ASML and major Asian semiconductor names also under significant pressure.
The immediate catalyst is a weekend push from several prominent AI leaders—including Anthropic's Dario Amodei, Sam Altman and Elon Musk—calling for greater restraint in the pace of frontier AI development. Investors are extrapolating that into the possibility of a slower AI capital-spending cycle, which directly challenges the earnings narrative supporting semiconductors, memory, networking and data-center infrastructure.
What's particularly interesting is that this isn't simply broad risk-off selling. Money appears to be rotating within technology itself. While chips and AI infrastructure are getting hit, cybersecurity names are showing relative strength.
Bottom line: this looks like more than an ordinary down day in tech. The market is aggressively questioning one of its most crowded leadership themes while simultaneously searching for new sponsorship elsewhere. The key now is whether AI infrastructure stabilizes quickly—or whether today's action marks the beginning of a more meaningful leadership transition. minervini.com


$CAMP is holding around $4.33 after another volatile swing between $4.22 and $4.48. The setup remains range-bound, with buyers defending $4.20–$4.24 and sellers showing up near $4.34–$4.36. A confirmed push above $4.36 could target $4.44, then $4.56–$4.57. If $4.20 fails, the $4.145 low becomes the next key level. Liquidity is extremely thin here, so expect wide spreads and sudden price gaps.

$SNYR is up 11.11% at $0.120 after a strong rebound from $0.1074. Price broke out of the $0.112–$0.113 consolidation range, with volume expanding into the move.
Key levels:
• Immediate support: $0.117–$0.118
• Major support: $0.113–$0.115
• Resistance: $0.120
• Breakout target: $0.122–$0.125
Momentum favors the bulls while $0.117 holds. A clean break above $0.120 with sustained volume could extend the rally, but expect high volatility at this price level. #SNYR #Stocks

$SNYR is still up 45.95%, but the intraday chart tells a more cautious story. After spiking to $0.139, price faded steadily and is now testing $0.1207 near the session low.
Key levels:
• Support: $0.119–$0.120
• Resistance: $0.123–$0.124
• Major resistance: $0.126–$0.128
Holding $0.119 could produce a bounce, but bulls need to reclaim $0.124 with volume before momentum improves. A loss of $0.119 would keep sellers in control. #SNYR #Stocks

$FTFT surged 32.01% to $2.759 after rebounding sharply from $1.92. Price is now consolidating above $2.70 following the high-volume breakout.
Key levels:
• Support: $2.60–$2.70
• Resistance: $2.82, then $2.94
• A clean break above $2.94 could open the door to $3.00+
Momentum remains bullish, but volatility is elevated—watch volume for confirmation. #FTFT #Stocks

$YMAT is still up over 38%, but the chart shows a major loss of momentum after the initial squeeze.Price exploded from the $1.34 area to a spike high of $3.28, then immediately sold off and spent the rest of the move printing lower highs. A recent bounce toward $2.05 was rejected, with price now consolidating around $1.83.Key levels:• Hold $1.78–$1.80 → potential short-term base
• Reclaim $1.90 → first sign buyers are returning
• Break $2.00–$2.05 → momentum could start rebuilding
• Lose $1.78 → watch $1.70, then $1.50The headline gain remains huge, but the structure is still bearish below $2.00. Bulls need a clean reversal with fresh volume—until then, this is a high-risk fade, not a confirmed breakout. ⚠️#YMAT #SmallCaps #Stocks #Trading
