

Company Builder and Investor, Cleantech, AI & Internet. Data visualization projects: The annual GHG Emissions variwide diagram, TVPI Spectrum™ Generator.
Munich, Germany
Joined December 2008
- Tweets528
- Following222
- Followers352
- Likes359
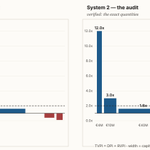




Every fund report is read by two minds in the same head.
System 1 judges the shape in a second. System 2 audits the numbers afterward. The partner glances; the analyst checks.
Most charts serve one and fail the other. 🧵
The whole essay — the two failure modes + how to make the glance and the audit agree, ~6 min:
tvpispectrum.com/essays/kahn…
Test it on your own numbers (free, in the browser):
tvpispectrum.com/?utm_source…

The usual fix — simple chart, detail in an appendix nobody opens — splits the difference. Wrong instinct.
The two systems aren't a slider. Serve both fully, in two layers of one picture, and make the readings agree.
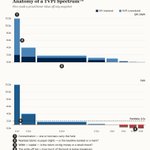
Five things a trained eye reads off a fund's TVPI Spectrum in ten seconds.
Once you know them, a chart that used to take a spreadsheet and twenty minutes takes a glance. 🧵
The whole thing — each read in full + a year-5-vs-year-8 worked example, ~6 min:
tvpispectrum.com/essays/prac…
Run it on your own numbers (free, in the browser):
tvpispectrum.com/?utm_source…
Read 3 is the one that changes the ranking.
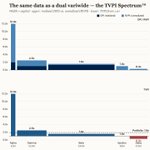
Width = capital. A 12× on a €3M check is a thin spike; a 1.8× on €40M is a wide block that actually moves the fund. Same TVPI headline, very different fund.
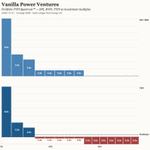
Two charts. The same six numbers.
One you read in a second — one you can't read at all.
The difference is perception. 🧵
None of it is decoration. Every choice lowers the cost of the first glance — so the fast read lands on the truth, and the analyst is free to audit the math instead of decoding the chart.
A chart that has to be explained has already failed.
Which choice would you argue with? Reply below — and follow if you want the rest of the series.
The whole essay — each principle in full, ~6 min:
tvpispectrum.com/essays/gest…
Draw your own (free, in the browser):
tvpispectrum.com/?utm_source…

A 3× on €1M and a 3× on €40M are the same number.
They are not the same event. One returned €2M; the other €80M.
Here is the charting problem hiding in a lot of fund reporting. 🧵
Full essay (~5 min):
tvpispectrum.com/essays/why-…
Free generator (browser-based, no signup):
tvpispectrum.com/
Now split each bar into realized cash (dark) and unrealized mark (light).
Alpha's 12× is almost entirely paper. Beta's 1.6× is mostly banked cash. This is the venture power law shown honestly — the headline winner is a mark until it exits. No single-row chart can show it.
