

TERRA Phenotyping Reference Platform. Advancing crop breeding and digital agriculture with lots of #opendata & #openscience.
- Tweets342
- Following132
- Followers344
- Likes312






ALT Figure 3. Example data from the TERRA-REF gantry system. (top left) RGB data (center top) RGB data with soil masked (top right) close up of RGB data. 3D-scanner data (center row, right to left) depth, reflectance, surface normals, and point cloud data produced by the 3D scanner. (bottom row, right to left) FLIR thermal image with transpiring leaves shown as cooler than soil; Fv/Fm derived from active fluorescence PSII sensor providing a measure of photosynthetic efficiency; the reflectance of light at 543nm wavelength measured by the VNIR hyperspectral camera. Because these are two-dimensional representations of three-dimensional systems, all scale bars are approximate.

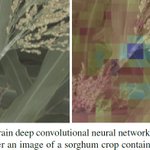
ALT Figure 1.We train deep convolutional neural network classifiers to predict whether an image of a sorghum crop contains a reference or alternate version of particular genetic marker, and then visualize why the network makes that prediction. In this figure, we show the visualization for why the neural network predicted an image showed a plant with a reference version of a SNP that controls leaf wax composition – the visualization highlights the especially waxy part of the stem.


ALT graphical representation of steps used in calibration of the hyperspectral camera


