
Just created this to answer a student's question. I do not care for social media, but maybe I can help demystify or correct some misconceptions about statistics
Joined June 2020
- Tweets169
- Following17
- Followers2.1K
- Likes1

Pinned Tweet
I meant to provide this link (someone put this kind of work in Jupyter and began expanding the datasets):
github.com/cjph8914/2020_ben…

Thank you to whoever took this over and developed an interest in the data collection and exploration/analysis. I am glad people are getting interested in learning this stuff!
For the few of you that liked the stats jokes, I will end the night with one: Why was Mr. Bernoulli Bayes known as the "man about town"? (answer in the reply)
Who knew that with less than 100 lines of code you could make half the country wish you were dead, the other half appreciate math, and approximately 0.00000001% laugh at what you thought were high quality stats jokes.
It was suggested I add a profile pic since evidently actual bots don't have them (did not know that). I like chess, so now my profile pic is related. Thanks for the suggestion.
So I am being accused of being:
- a Russsian bot
- a Fake account
- a Qanon handler (unless I misread that)
- a criminal
- an election interfere
At this point I want to go back to make silly stats jokes that no one laughed at.
*interferer
Look, I would like to point out that no one has to trust anything and you are strongly encouraged to run your own analysis. That's sort of the point. Learn to code a bit, collect some data, and run some analysis.
People are asking for the code not in image form. I was just told I can use this site to do it, so here you go.
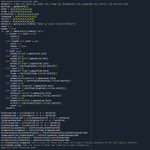
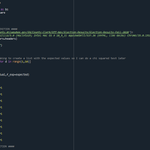
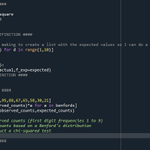
pastebin.com/YKFyKtbc
I should make clear that I am not trying to endorse or refute any political party. I'm analyzing data and I feel we should all be free to analyze data. Ideally I wouldn't even know who the numbers are associated with and I could be free to just analyze them in the blind.
I am making these tweets to explain in one place some analysis that was done last night.
1 - I was asked offline about doing Benford's on election data. I explained that this is common and a useful way to detect anomalies in data that are driven by artificial process (e.g. fraud)
15 - Here:
Lesperance, M., Reed, W. J., Stephens, M. A., Tsao, C., & Wilton, B. (2016). Assessing Conformance with Benford’s Law: Goodness-Of-Fit Tests and Simultaneous Confidence Intervals. PLoS ONE, 11(3). doi.org/10.1371/journal.pone…
14 - What is notable is the extreme difference in their p-values. The drawback to this analysis is that there is a Better test for Benford's goodness of fit. It is the Watson version of the Cramer von Mises test (U2). You can read about why it is better here (next message)
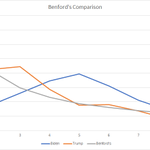
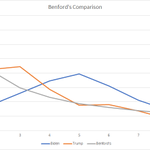
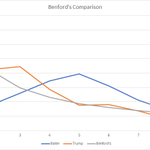
12 - And here are the raw numbers (1 to 9):
Biden: [86, 35, 52, 69, 79, 62, 42, 28, 22]
Trump: [115, 85, 89, 57, 35, 36, 27, 16, 16]
11 - In the end, Biden's vote data from that page is far more anomalous than Trump's. Here is what it looks like visually:


9 - The final process, put together, has some additional code to handle data and count the digits from that webpage (comes in 2 parts, first script setup and function definition, then the script on next tweet):

