
Full-time CANSLIM stock market trader, Christian conservative, tennis player, CPA
Mississippi
Joined April 2009
- Tweets897
- Following280
- Followers3K
- Likes2K




Steve Swetz retweeted

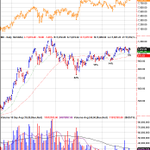
Keep the Chart as Simple as Possible.
2 Main Things to Learn From This Chart.
1. Tight Ranges and Box Breakouts are the best time to enter in any trade, they give explosive returns.
2. Enter new Position or add more only when you have a proper base break.
Read Chart in Detail, Save it, Share it.

I asked Google Gemini the following question: What have been the top 20 best performing stocks since October 2022 with a market capitalization of at least $10 billion?
I got the following list.
Top 20 Best-Performing Large-Cap Stocks (Oct 2022 – Oct 2026)
Rank Ticker Starting Price (Oct '22) Current Price (Oct '26) Return Multiple Primary Industry Sector
1 SNDK $36.00 $1,371.12 37.09x Data Storage & Flash Restructuring
2 PLTR $8.24 $194.15 22.56x Enterprise AI Software
3 STRL $22.68 $423.48 17.67x Data Center Civil Infrastructure
4 MU $51.72 $904.90 16.50x High-Bandwidth Memory (AI)
5 NVDA $12.51 $217.09 16.35x Semiconductors / AI Compute
6 CRDO $11.31 $172.81 14.28x High-Speed Optical Connectivity
7 FIX $103.38 $1,464.07 13.16x Data Center Modular Cooling/HVAC
8 CVNA $4.29 $58.71 12.69x E-Commerce Automotive Retail
9 WDC $25.74 $352.21 12.68x Hard Disk Drives & Cloud Storage
10 APP $20.42 $269.12 12.18x AI-Powered Mobile Advertising
11 SMMT $1.21 $15.57 11.87x Oncology Biotechnology
12 DELL $35.88 $455.44 11.69x AI-Optimized Enterprise Servers
13 STX $54.76 $660.81 11.07x Mass-Data Enterprise Storage
14 RKLB $4.31 $51.36 10.92x Aerospace & Space Launch Services
15 LITE $70.94 $834.51 10.76x Optical & Laser Infrastructure
16 CRS $33.26 $378.51 10.38x Specialty Aerospace Alloys
17 FTAI $15.68 $163.27 9.41x Commercial Jet Engine Leasing
18 ROIV $3.36 $34.71 9.33x Immunology & Royalty Biopharma
19 HOOD $10.10 $96.52 8.56x Retail Brokerage & Crypto Expansion
20 RVMD $19.53 $182.09 8.32x Precision Oncology / Cancer Therapy
I would seriously study the fundamentals and monthly/weekly/daily charts of these stocks so we can identify the next model book stocks.
Steve Swetz retweeted

Join us again This Wed Oct 21st at 7:00 pm PST with
@sswetz @ThePath2Profit and Amy Smith as a special guest. We'll cover the market from A to Z and give you the best stock ideas. #IBD #INVESTING #STOCKS
#investors #IBD #money Reg link below us02web.zoom.us/webinar/regi…

Steve Swetz retweeted

Diary of a Growth Portfolio Manager 100% Cash
We came into Monday Oct. 12 100% long primarily concentrated in indexes and Etf's. We got stopped out of $Mrvl. 90% long.
Tue Oct 13 We got stopped out of $Dell. 85% long.
Wed Oct 14 We had what we call a character change expectation breaker day and sold the majority our longs in $TQQQ, $UPRO, $MAGS, $Nvda and $Hood to go to 10% long and 90% cash.
Thur Oct. 14 we sold the last part of our $UPRO position and our 3% position in $IBIT and our 1% in $ETHA to go to a 100% Cash position where we remain today. We refuse to have a bullish or bearish thesis here as both stances can be compelling. In our view, the trend is down based on our assessment of prices and corroborated by technical indicators. When these conditions change, we will change our view and add exposure. These conditions can change in a day if institutions pile in and a stampede occurs. In the meantime, we will wait and let the market dictate our exposure. Oct. 2025 - Oct. 2026 has been the most difficult period to trade in my career of 39 years even surpassing the internet bubble in 2000-2003 and the great financial crisis of 2007-2009. The good news is after these choppy environments you can make life changing money. This will be no different! Stay engaged.
Steve Swetz retweeted

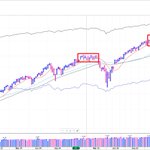
The Nasdaq broke decisively below key support at its 50-day SMA and 65-day EMA on heavy volume Friday afternoon. The S&P 500 held up somewhat better, closing below its 50-day SMA but above its 65-day EMA. Small caps continued to lead the market lower, with the Russell 2000 closing at yet another lower low to end the week. The Dow held up best among the four major indexes, but its relative strength matters less given the broader deterioration.
Breadth continued to weaken, with 143 new highs versus 460 new lows on Friday. Not only did the major indexes finally break down, but many leaders across traditional growth sectors also succumbed to selling pressure late last week.
Defensive groups—including oil and gas, miners, and utilities—led the market Friday. A smaller group of leaders in biotech, restaurants, insurance, and specialty retail continues to show relative strength. However, if selling pressure persists across traditional growth leadership, the major indexes will likely face further downside pressure next week.
I was finally forced back to cash and will remain there until the market provides sufficient evidence that taking long exposure is warranted again. No one knows how long that will take, so there’s no reason to rush.
For now, cash is king. Keep running your screens, maintain your watch lists, and stay prepared. When the market begins to improve, you want to be ready—not scrambling to catch up.


Link to my WOO spreadsheet which gets updated each day. The WOO ended Thursday. The WOO is now looking for either a follow-through day which can happen 4 days from a rally day (3 days on very, very rare occasions) or when the MMTS signal turns green. The MMTS signal turns green when the Nasdaq composite index closes at least 1% above its 21 day EMA while the 10 day MA slopes up.
There are generally 2-4 WOOs each year. We had one that began on 2/25 which quickly failed. We had a good one that began on 4/8 which turned out to be a great money maker (think MU, SNDK, LITE, BE, DELL). We had another pretty good one that began on 6/15. The last WOO began on 7/31 from a shakeout buy day which just ended Thursday. We may get one more WOO. However, we are now 4 years into the bull market which began in October 2022 so the next WOO may fail too after having 3 successful ones in a row.
My job is to take advantage of each WOO, especially the ones that begin after deeper & longer corrections like the corrections we saw in early 2025 and early 2026. My job is also to not give back much gains, if any at all, when the WOO is closed.
docs.google.com/spreadsheets…

Steve Swetz retweeted

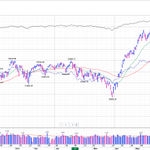
26 years ago, when I was starting with charting/trading and investments if someone gave me this advice, I would thank him/her every single day:
Print this chart. Put it on your desk.
Expand your research/investment universe.
Look for only 1 setup. The setup that is on this chart.
Go and look for this setup, if possible, across 2000 charts.
All your trades will be executed through this basic chart pattern setup.
When you revisit the charts you will be able to identify the setup you traded again and again.
You can thank me later. Don't forget to print it.

Steve Swetz retweeted

"Christ is the wellspring of happiness. He is the fountainhead of joy. Here is the Christian's secret of joy." —Billy Graham
Steve Swetz retweeted
"The soul longs for God. Down deep inside every person's heart is a cry for something, but he doesn't quite know what it is. ... Your soul longs for vital contact with God." —Billy Graham
Steve Swetz retweeted
Join us again on Wed Oct 21st at 7:00 pm PST with @sswetz @ThePath2Profit and guest for a full market overview and the best stock ideas. $SPY $QQQ $DIA #investors #IBD #money #tariffs Reg link below. us02web.zoom.us/webinar/regi…

These 4 attributes for a good trading mindset/attitude comes from someone else but I embrace them fully when I begin each trading day: (1) focused on my plan, routine, and my emotional awareness without any distractions, (2) fearless in showing no hesitation in executing my plan and in truly accepting the portfolio equity risk for my position size, (3) confident that following my rules, routines, and the CANSLIME method will lead to success over the long-run, & (4) care-free in truly not caring whether the market or the stocks go up or down each day. All I am doing is consistently executing a routine and plan with discipliine. Embracing these 4 attributes may help you in your trading too. As we know, successful trading is a lot more than reading a chart or selecting a stock.
Anytime I see a base, I ask myself this critical question "Is this Base under Accumulation or Distribution?" These are the signs I look for to help me answer this question.
Signs of Accumulation
1. Higher Swing Lows on the Right Hand Side of the Base
2. Shakeouts at Support Areas of the Base
3. Support Weekly/Daily Bars at the Lows of the Base
4. Weak Reactions(narrow spreads w/weak volume) to the Lows of the Base
5. Wide Spread(includes Gaps) Strong Close Weekly/Daily Bars with Strong Volume followed by Relatively Weaker Reactions
6. Strong Upside Follow-through(very little overlap of the ranges of the bars)
7. Tightness on the Right Hand Side of the Base
8. Relative Strength vs. S&P index on the Right Hand Side of the Base
Signs of Distribution
1. Lower Swing Highs on the Right Hand Side of the Base
2. Upthrusts at Resistance Areas of the Base
3. Stalling Weekly/Daily Bars at the Highs of the Base
4. Weak Rallies(narrow spreads w/weak volume) to the Highs of the Base
5. Wide Spread(includes Gaps) Poor Close Weekly/Daily Bars with Strong Volume followed by Relatively Weaker Rallies
6. Strong Downside Follow-through(very little overlap of the ranges of the bars)
7. Wide & Loose on the Right Hand Side of the Base
8. Relative Weakness vs. S&P index on the Right Hand Side of the Base
Steve Swetz retweeted

I can still hear Bill saying…
“Rules, Rules, RULES!”
Then he’d pound the desk with his 👊
My take on rules, I hope it helps🍀
WRO #90 Rules, Rules, Rules youtu.be/fvg6wLnK--g?is=5sFn… via @YouTube

Steve Swetz retweeted
I see some folks still focused on the bond market🤷♂️
If you trade bonds…focus on the bond market
BUT if you trade GROWTH stocks…watch GROWTH stocks & the Nasdaq
I’m still on an X break, but it needed to be said, hope it helps🍀
We’re in a BULL you know🤠

My response to a question from my buddy @alphatrends …
I’ll be taking a break from X & possibly my WROs (although I have enough in the can for a few weeks) while I deal with some extremely heavy personal stuff. Unfortunately, I have to skip this weekend’s IBD event in Vegas to be with family.
But I thought I’d answer this one before my break… as my take on this tends to be controversial and misunderstood.
While the seed of this idea came from Bill…I take it to the extreme
First, yes of course the bond market & all things related the FOMC, yield curve, etc…is extremely important to the economy & therefore the stock market.
Second, IMO fixed income guys tend to be smarter & more tuned into the economy than equity folks.
Third, all things are interconnected, fixed income (globally), central banks (globally), currencies, geopolitics, global equity markets, futures, options, crypto…etc everything!
Fourth, if you believe you have an edge integrating your analysis of the above…then you are very rare…good for you. Keep doing it.
Fifth, while I don’t use the above directly…I’m always aware of them on a daily basis as it gives context for moves in the equity markets.
Sixth, Bill told me early on to ONLY focus on the stock market. His take…which I absolutely agree with and have used for 25+ years…the market knows everything!!
Meaning the large funds have deep teams of analysts and PMs who spend all their time analyzing all the above better than any single person could do…so why not ride their coattails🤷♂️
That’s what Bill did!
So yes, yields have been in a strong tend going in the wrong direction…BUT here’s the KEY TELL…
The stock market has absorbed all that info and is at/near all time highs! So in other words…it’s in the spirit of a news failure (using a term most would know) if the market does go down in light of yields going crazy…well then it’s even stronger that we think.
I recall several times when Bill was trying to make space in the physical paper…he wanted to remove the ONLY reference to the bond market that we had…a small yield curve near the back of the paper…but he got enough pushback internally that he left it in🤣
My take on the market remains the same…I believe the true inflection point was the markets reaction to the FOMC 9/16 presser. That should have pushed us lower…much lower!
When it didn’t that was your tell!
The action in the following days confirmed it…and feels similar to late October 1999 (from memory 10/29/99 =9/21/26…I’m at an airport, not looking at the 1999 chart…so I could be off by a day or too…but I doubt it).
So I believe we are in the early days of another significant leg higher.
With that said..that’s an opinion…so to change my mind…we’d need a close below the low of 9/21…giving it a bit more space…the low of 9/18.
Just my take…I’ll keep an open mind and be flexible as always.
As always..,trade your way…this is just the take of a random dude who talks too much
Best of luck 🍀