

Trying to help people learn more about analytics with football (soccer) data.
Joined April 2022
- Tweets1K
- Following246
- Followers7.9K
- Likes828



Pinned Tweet
Everyone: "It's impossible to create beautiful charts with @matplotlib."
Matplotlib: "Hold my beer".
-------------------------------------------------------
Code & examples of +20 charts:
sonofacorner.com/gallery/


NEW VIZ 📊
🎯 The 2022/23 Premier League's Top Shooters.
(inspired by @jonollington)

NEW VIZ 📊
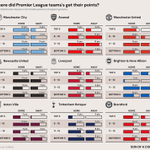
How did top Premier League teams fare against each opposing bracket group?
(based on the final table position of the opposition)

Son of a corner retweeted

👾 Learn to code using football data
imo, everyone can code. But coding is not always easy to pick up. This isn't the learner's fault at all.
I've put together a few tutorials using football data from FBref that I hope will help people get started
mrkthmpsn-streamlit-coding-t…

This looks amazing 😍

A look at how many goals the GKers in the danish superliga are preventing.
Measured as the expected goal after the shot minus conceded goals.
#sldk
@sonofacorner

I forgot how much I enjoyed doing this 🥰
(if you're interested you can download the high-resolution image here: drive.google.com/file/d/1FAo…)

Son of a corner retweeted

🚨 Guide to Sports Analytics 📊
New design & we now cover 4! softwares in-depth (R, Python, Tableau, SQL). In total, links to 500+ tutorials, 250+ data sources, 125+ accounts to follow, 50 books, 40 cheatsheets, 40 papers & more. All in ONE place!! ⬇️
docs.google.com/spreadsheets…


I've decided to cancel the paid membership behind SOC.
This doesn't mean that I'm stepping away from the project. It just means I don't feel comfortable asking for recurring financial support when I've been so inconsistent.
Personal lessons I've learned (for those interested).
I will try out that option for the coming months and see how it goes (I'm doing it via @kofi_button at ko-fi.com/sonofacorner)
Also, I'd like to test out the possibility of creating digital products for very specific topics as a personal experiment in the future.

Twitter is weird.
Visual I'm really excited about and took more than 5 hours to make, 30 likes.
Visual that I thought was not my best work and took 30 minutes to make, 250 likes.
Experimental viz 👀
This week, I wanted to mix histograms, scatter plots, and line charts in a single plot.
Here's the result 👇😋


📊 NEW VIZ
🏴FA Cup | Man City vs. Arsenal | Pass "solars"
This week I decided to attempt @unarsezer 's cool idea of visualizing passes as a solar system instead of the usual passing network.
It was really hard (but fun) 😂
What do you think?
Code: sonofacorner.com/pass-solars…
