

Where the seen meets the unseen in global finance. Shadow banking, capital flows, regime shifts. Charts, macro analysis, & whatever cuts through the noise.
Pennsylvania
Joined November 2025
- Tweets34
- Following31
- Followers15
- Likes8
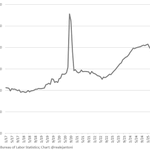
This chart is exactly what a re-privatizing economy looks like.
For 15 years, growth was artificially smoothed by govt spending, ZIRP, QE, and pandemic fiscal engineering. That regime suppressed failures and pushed risk upward into a systemic boom cycle.

Despite further job reductions in the federal gov't, state and local gov't net hiring more than offset those declines; even still, private sector gains were almost 5X public sector gains in Sep:

1
1
30
The transition is messy, but it’s also the precondition for a healthier long-term expansion.
Once the economy stands on its own balance sheet—without federal scaffolding—we get more sustainable private-sector growth rather than stimulus-inflated demand.
1
11
Populism is rising on the right and the left. Everyone talks about “wealth inequality,” but almost nobody explains what actually drives it.
So I built a structural model using 35 years of quarterly data.
Shockingly, only three variables explain 93% of the movement in U.S. wealth inequality since 1990.
Not tax rates.
Not CEO pay.
Not political rhetoric.
Three macro forces.
(1/)
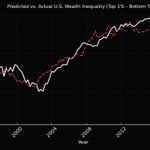
Here is the model’s fit:
Actual vs. Predicted Inequality (1990–2025)
The model doesn’t chase every wiggle.
It captures the structure—the part driven by global finance, not politics.
(11/)

1
1
19