

This is my personal account where I may occasionally share maps and other items of interest.
London, UK
Joined June 2011
- Tweets324
- Following556
- Followers300
- Likes1.9K




#30DayMapChallenge Day 29: Raster and Day 30: Makeover
An old map (1882) of the Isle of Elba given an exaggerated elevation makeover using DEM. Made in #qgis and #b3d
(Source of data: Regione Toscana – Modello Digitale del Terreno Orografico,License: CC BY 4.0)


Sam J retweeted

Medieval London Bridge: my Digital Reconstruction (c. 1400 CE) placing the lost structure back into the modern Thames & removing the modern one next to it. First edition for #30DayMapChallenge . Model by David Aggett 1987, scan by @artfletch . Completed in 1209, it remained the City of London’s sole river crossing until 1729. #b3d

I also meant to post the global version of my #hex shark map for yesterday's (day 25) #30DayMapChallenge. Made with #mapbox
#30DayMapChallenge Day 25: Hexagons
A little 3d hexmap of the bluntnose sixgill shark - aka Hexanchus griseus - and the largest hexanchoid shark.
Made in #qgis and #b3d with data from gbif

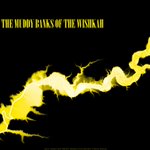
#30DayMapChallenge Day 20: Water
Been meaning to attempt a relative elevation model for a while now, so had a first stab using the tutorial by Dan Coe.
Wishkah River, Washington. Strongly associated with one of my favourite bands of course.
Made in #qgis

Yellow probably wasn't the best colour choice, but well it was part of my theme.
Anyway link to the tutorial that i used:
dancoecarto.com/creating-rem…

#30DayMapChallenge Day 18: Out of this World
Not quite what I originally set out to achieve, but nonetheless some sort of map celebrating the #Predator movie (1987)


#30DayMapChallenge Day 16: Cell | Day 17: New tool
Playing around with some of the #mapbox gl js light settings on the BT Tower in Birmingham
#30DayMapChallenge Day 15 – Fire.
I am still catching up so another simple one here. Place names in GB that begin with or end with 'burn'. Based on @OrdnanceSurvey #zoomstack data, made in #qgis.

the original graphic I attempted to digitise in order to create a DEM. taken from alientimeline.wordpress.com/…

#30DayMapChallenge Day 13: A ten minute map and Day 14: OpenStreetMap
A quick map of Budapest. Actually took a lot less than 10 minutes using
@anvaka's city generator available at anvaka.github.io/city-roads/ which is based on OpenStreetMap data

#30DayMapChallenge Day 10: Air and Day 11: Minimal
I fell behind so playing catchup, with a #joyplot map of air particulate matter based on data downloaded from NASA Earthdata. Made in #qgis.

#30DayMapChallenge Day 9: Analogue
An early example of choropleth disease mapping: Joseph-François Malgaigne’s map of hernia incidence in France, 1840
