

Geospatial data analyst | Formerly @PodsProgram, @mcgillgeography | Data nerd, climate justice nerd, art nerd (just a nerd?) He/Him
Joined March 2015
- Tweets22
- Following100
- Followers42
- Likes100

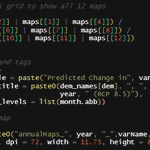




Hey @R4DScommunity , could anyone help me understand plot export dimensions? I'm trying to make a 1-page grid containing 12 maps, but the legends seem to eat all my exported plot space! Please help! #dataviz #DataVisualization #ggplot2 (code follows)
Some success! Still have lots to learn about graphics, but this has been VERY helpful :) Thank you @taraskaduk @BoaNarlon and @jsavinc for your tips and resources, and @R4DScommunity for helping me scream not into the void!


Saeesh Mangwani retweeted
Hey @R4DScommunity , could anyone help me understand plot export dimensions? I'm trying to make a 1-page grid containing 12 maps, but the legends seem to eat all my exported plot space! Please help! #dataviz #DataVisualization #ggplot2 (code follows)
This is the (abstracted) code for created the patch grid (1). It works great, except that the output grid always looks like some variation of (2). I tried gathering the legends but that seems to fail too.


Visual platforms like google earth seem to be our de-facto standard for “exploring” places we’ve never seen, right? Here’s a cool #neogeoweb challenge to the visual bias in our digital journeys: citiesandmemory.com/. You’re welcome.
Most digital earth platforms I’ve seen for transport are highly local, so when I found flightradar24.com/, I was intrigued. It locates thousands of flights globally in real-time. Interesting to visualise some of the patterns (and biases) in air-traffic globally #neogeoweb
Hello World! I'm taking a class this semester on learning about the Geospatial Web aka the #neogeoweb, so I'm soon to be back at posting random code chunks and map screenshots :) Looking forward to learning and sharing with GEOG384 and the rest of the #DataScience community!
What an honour to get a chance to speak with @thomas_mock this week! I am still overwhelmed by how supportive the entire @R4DScommunity has been as we venture into #rstats with the @PodsProgram

Spoke with the @PodsProgram students yesterday - what a great bunch of Social Science undergrads!! Thanks @markdaku for setting up the meeting!
If you had some advice or career paths for #data4good with #DataScience, what would it be?
#rstats #Python #podsprogram
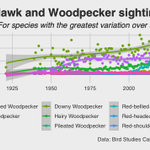
Yesterday's #TidyTuesday with the @PodsProgram was a fun test of skills, as I tried to examine sighting rates for Hawks and Woodpeckers over time. If anyone has thoughts on which of these (below) formats is better, I'd love some design insights! #rstats


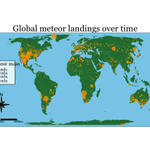
Late but here! Yesterday's #TidyTuesday with the @PodsProgram was a challenge, as I tried moving up in gganimate (1) and exploring the tmap package (2). Wasn't able to animate a cumulative map with tmap though, so any suggestions are welcome! #rstats

Apparently now I know as much about R animation as @seanossek. @markdaku are you proud? #TidyTuesday #rstats
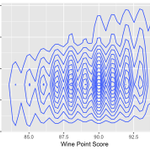
first attempt at a ggplot2 visualization for #TidyTuesday as part of the @PodsProgram ! Send me your thoughts :)
