

Husband | Dad | Runner | Worker ... here exploring data visualization as a creative outlet ... All opinions are my own
Charlotte, NC
Joined May 2009
- Tweets785
- Following427
- Followers624
- Likes3.2K




Pinned Tweet
#TidyTuesday | Week 1 | Bring your own data (BYOD)
Visualizing my past running 🏃♂️data using Strava's API and the GitHub (dark mode) code contribution chart for design inspiration.
code: github.com/curatedmess/TidyT…
#rstats #dataviz

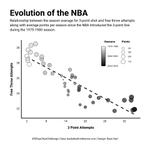
#30DayChartChallenge | April 2024 - Day 20 | correlation
A 📊 chart showing the relationship between 3PT attempts and FT attempts...as a casual NBA fan, seems intuitive that this might be negatively correlated.
code: github.com/curatedmess/30Day…
#ggplot2 #rstats #dataviz

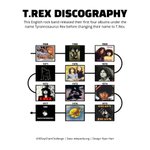
#30DayChartChallenge | April 2024 - Day 19 | dinosaurs
A 📊showing the timeline of albums released by the English rock band, T.Rex 🦖
code: github.com/curatedmess/30Day…
#ggplot2 #rstats #dataviz

#30DayChartChallenge | April 2024 - Day 18 | Asian Development Bank (data day)
Playing catch up for yesterday....A📊showing financed amounts in South Asia for 2023.
code: github.com/curatedmess/30Day…
#ggplot2 #rstats #dataviz

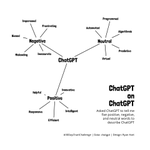
#30DayChartChallenge | April 2024 - Day 17 | networks
A 📊 showing word association with ChatGPT.
code: github.com/curatedmess/30Day…
#ggplot2 #rstats #dataviz

#30DayChartChallenge | April 2024 - Day 16 | weather
A 📊 showing the 75 years of high/low temps in Charlotte for a random day, April 13.
code: github.com/curatedmess/30Day…
#ggplot2 #rstats #dataviz

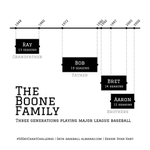
#30DayChartChallenge | April 2024 - Day 15 | historical
A 📊 showing a multi-generational family playing professional baseball in MLB for a combined 58 years
code: github.com/curatedmess/30Day…
#ggplot2 #rstats #dataviz

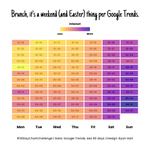
#30DayChartChallenge | April 2024 - Day 14 | heat map
A 📊chart showing Google Trends , last 90 days for search term = "Brunch"
code: github.com/curatedmess/30Day…
#ggplot2 #rstats #dataviz

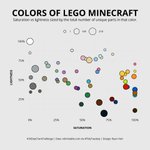
#30DayChartChallenge | April 2024 - Day 13 | Family
A 📊 chart showing the Lego brick colors for the Minecraft theme. Legos and Minecraft are big with my family. #TidyTuesday data set from week # 36, 2022.
code: github.com/curatedmess/30Day…
#ggplot2 #rstats #dataviz

#30DayChartChallenge | April 2024 - Day 11 | Mobile Friendly
Distribution of the iPhone weights throughout it's evolution 📊 (iPhone Gen 1 to iPhone 15s)
code: github.com/curatedmess/30Day…
#ggplot2 #rstats #dataviz


#30DayChartChallenge | April 2024 - Day 10 | Physical
A 📊 distribution of Iron Mike's fight durations for his professional boxing career. I can't think anything more physical than stepping in a ring with Tyson.
code: github.com/curatedmess/30Day…
#ggplot2 #rstats #dataviz

#30DayChartChallenge | April 2024 - Day 9 | Major/Minor
Messi goals 📊
"I am also aware that I went to a minor league, but a lot happens because of the way one faces it and competes." said Messi to Star+ about Miami.
code: github.com/curatedmess/30Day…
#ggplot2 #rstats #dataviz

#30DayChartChallenge | April 2024 - Day 8 | Circular
A 📊 showing Caitlin Clark's career points as the all-time NCAA scoring leader from Iowa, utilizing a uniform distribution of random numbers to plot the basketballs.
code: github.com/curatedmess/30Day…
#ggplot2 #rstats #dataviz

#30DayChartChallenge | April 2024 - Day 7 | Hazards
A 📊 about lightening events in North Carolina, U.S.A using FEMA's National Risk Index data.
code: github.com/curatedmess/30Day…
#ggplot2 #rstats #dataviz


#30DayChartChallenge | April 2024 - Day 6 | OECD
A 📊 at self-reported sick days. What's odd is that the US saw a significant increase in 2019 (+ 3.4 days) ending a declining trend.
code: github.com/curatedmess/30Day…
#ggplot2 #rstats #dataviz

#30DayChartChallenge | April 2024 - Day 5 | Diverging
A 📊 Looking at the split of my runs from the last four years before or after 7 AM. Also, only ran six times after noon...I guess I'm more of a morning person.
code: github.com/curatedmess/30Day…
#ggplot2 #rstats #dataviz

#30DayChartChallenge | April 2024 - Day 4 | Waffle
A waffle 📊 of sorts. 72% of the world's leading chess players have compatriots among the top 25 ranks.
code: github.com/curatedmess/30Day…
#ggplot2 #rstats #dataviz

#30DayChartChallenge | April 2024 - Day 3 | Makeover
Old enough to remember MTV's Pimp my Ride? A 📊 about the types of vehicles that got a makeover over the six seasons of the show.
code: github.com/curatedmess/30Day…
#ggplot #rstats #dataviz
