

Data Visualization Designer, Infographics, Presentations, Author @coolinfographic, Keynote speaker, President @InfoNewt, Instructor @SMUCAPE, DFW DataViz Meetup
Dallas/Fort Worth, Texas
Joined April 2007
- Tweets7.4K
- Following2.5K
- Followers9.2K
- Likes1.1K
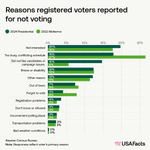






Registered voters not participating in mid-term elections is a huge issue. Great data and analysis from @USAFacts .
usafacts.org/articles/why-do…

Add your name to the Open Letter to Congress from USAFacts to support public data, and improve the data we depend on to maker informed decisions.
usafacts.org/data-we-depend-…

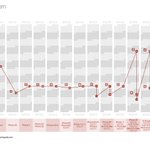
Following up on my DST post yesterday, this infographic from Andy Woodruff in 2019, is a good way to show that permanent Standard Time would be better for most people than moving to permanent Daylight Saving Time. coolinfographics.com/blog/20…

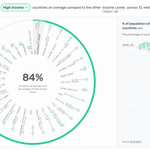
Do you support the "Sunshine Protection Act” to make Daylight Saving Time permanent in America? Use the Daylight Saving Time Gripe tool to determine if Standard time or Daylight time would be better for you and post your result
observablehq.com/@awoodruff/…

Have a SkillShare account? I have a short course available that guides you through applying #dataviz best practices in PowerPoint. This course can enhance your presentation skills and help you effectively communicate your data. #powerpoint #presentations skl.sh/4igKkEV

I'm so frustrated with Apple's dark patterns to trick people into upgrading iOS. 🤬 Tricked my 90+ year-old MIL into upgrading both her iPhone and iPad at the worst possible time! There's no obvious way to postpone the update to another day unless you figure out the trick.

Apple traditionally doesn't release any products during December, so all of my Apple Release Pattern #infographics are complete and up-to-date for 2025. Are you looking forward to any #Apple product updates in 2026?
infonewt.com/apple-release-p…

The Planetary Society has a great collection of #infographics and data visualizations (#DataVisualization) about NASA and the state of the U.S. Space Program. coolinfographics.com/blog/20…

For all of my fellow book authors, you can now positively determine if pirated copies of your book(s) were illegally used in the training of AI models. coolinfographics.com/blog/20…
New book arrived today! Congrats to Steve Wexler, Jeffrey Shaffer, Andy Cotgreave, and Amanda Makulec!!! 🎉

I'll be giving my updated talk on #dataviz in AR & VR in a free online Meetup event on Feb 13th. Join through your local DataViz Meetup group, or you can register here: us02web.zoom.us/webinar/regi…

Cultivating a creative community with Tina Roth-Eisenberg of Creative Mornings: ow.ly/zkJo50ONFal

Introducing Microsoft Fabric: Data analytics for the era of AI, integrating technologies like Azure Data Factory, Azure Synapse Analytics, and Power BI into a single unified product ow.ly/4MY750OGm8K

27+ (Secrets) on How To Create An Awesome Viral Infographic in 2023 - great content and tips, but not a great infographic (sadly) coolinfographics.com/blog/20…

Chart Reader: Accessible Visualization Experiences Designed with Screen Reader Users: ow.ly/SjK450OGm2I

Check out the new page for the Open Climate Data project from Creative Commons which launched in Spring 2023, to facilitate the opening and sharing of climate datasets and data models available across the globe. ow.ly/v3UM50OAmIh

How to maximize your marketing content and reach every audience you want: ow.ly/3hBk50Ov2Xn
