Daily insights on R programming, tidyverse, data science, and data visualisation.Practical tips, clean code, and reproducible workflows.

Joined January 2023
Does the market still reward the college degree in 2026? 📉
1
1
12
114,025
How do you make better decisions while the evidence is still arriving? That question is at the heart of my upcoming book, Adaptive Bandit Methods with R, and a new R package I’m developing: banditlab. The book explores experimentation, contextual decisions and online learning. banditlab will help put those ideas into practice. More to share soon. #RStats #bandits
1
59
A chart can be numerically correct and still mislead. Both panels show the same values: 96 and 100. The left truncates the axis. The right restores the zero baseline. Before trusting the story, check the baseline, scale, denominator and time window. Let the data speak. #DataViz #RStats #ggplot code: tinyurl.com/885f827j
1
1
112
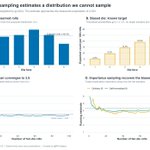
Statistics gives us a disciplined way to learn about quantities we cannot observe directly. In this example, fair-die samples are reweighted to estimate the expectation of a biased die. The mathematics provides the estimator. R makes its convergence visible. #RStats
1
5
173
RProDigest | R Programming & Data Science retweeted
The "Mathematical and Statistical Foundations of AI" book by Saman Siadati is now available on @ChapterPal . The book provides a concise, practical guide to the essential mathematics and statistics required for building a strong foundation in artificial intelligence. Learn complex topics with an AI tutor: chapterpal.com/book/c27968f0… (The content is free to read when you are logged in. Accounts on ChapterPal are free unless you want to upgrade.) If you see any issues with the content, please report them to me.
1
5
1
40
3,685
Your Markdown file is already closer to a polished PDF than you think. One command in the terminal: `quarto render README.md --to typst` Quarto handles the content. Typst handles the typesetting. The result is a professional PDF from plain text. #QuartoPub #Typst #Markdown
148
No copying into Word. No rebuilding the layout. No separate publishing workflow. Just run: quarto render README.md --to typst Your Markdown README becomes a beautifully typeset PDF. One source. Two purposes. Far less friction. #QuartoPub #Typst
158
RProDigest | R Programming & Data Science retweeted
🚀 T v0.54.2 is Live! This release added a new built-in package, called testcraft, which will make it much easier to verify the results produced by your reproducible pipelines! Whether you’re writing unit tests manually or building AI-driven workflows that auto-fix broken pipelines, this release has something for you. Here are the highlights: --- 🛠️ Introducing `testcraft`: A First-Class Assertion Framework Testing complex data structures, pipelines, and types should be intuitive and resilient. `testcraft` introduces 40 dedicated `expect_*` functions with built-in safety features: * Three-Tier Expectation System: Distinguishes between passed (`Expect_pass`), clear failure (`Expect_stop`), and indeterminate cases (`Expect_hold` for handling missing/`NA` values gracefully). * Deep VDict Comparison: Order-insensitive, recursive structural comparison of nested dictionaries with crash-safe evaluation. * Comprehensive Coverage: Native assertions covering equality, type checks, dataset/table structures, pipeline nodes, error handling, and string matching. * Inline Node Assertions: Use `check()` directly inside pipeline nodes to enforce invariants while preserving error signals. --- 🤖 Built for the AI Era: Agentic Testing in `t test` I designed the latest test runner enhancements so both developers and AI Agents can inspect, parse, and act on test results seamlessly: * 🤖 Structured JSON Output (`t test --json`): Emits schema v1 JSON containing per-file statuses, execution duration (`duration_ms`), and error details, ideal for feeding directly into LLM agent tools or CI automation loops. * 📊 REPL `t_test()` Returns a DataFrame: No more plain text logs when testing interactively! `t_test()` now returns a native DataFrame, allowing you to filter and inspect test results programmatically using T's pipeline operators: ```t t_test() |> filter($status == "failed") ``` --- ⚡ Modern Test Runner Power Features * Targeted Execution: Flexible filtering with `--only "stats"` and `--not "slow"`, plus `.tignore` file support. * Pipeline Auto-Evaluation: `t test` automatically evaluates embedded pipeline definitions and reports node failures inline. * CI & Observability Ready: Native JUnit XML output (`--format junit`), `--failfast` execution, execution timeouts (`--timeout`), and code coverage reporting (`--coverage`). --- 💡 Try it today! tstats-project.org/getting-s… #Reproducibility #RStats #Python #Julia
1
1
6
508
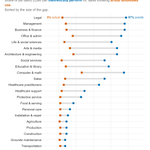
I redrew Figure 2 from Anthropic’s Labor Market Impacts of AI report to make the comparison easier to read. The message is striking: LLM capability is already broad across white-collar work, but actual automated use remains far behind. Capability is not adoption. Source: Massenkoff & McCrory (2026), Figure 2, p. 6.. #AI #FutureOfWork #DataViz
1
3
216
Every 10x in compute buys you a predictable drop in model error. The catch? That next 10x gets exponentially more expensive. #ggplot2. Code is here: tinyurl.com/whpv9hj7
3
122
Stop dragging boxes around in PowerPoint. DiagrammeR lets you build stunning, reproducible flowcharts and architecture diagrams directly in #RStats. Code > Clicks.
2
79
Mapping the architecture of Generative AI. Built entirely in R, structured via a strict edge-list, and styled with the Okabe-Ito palette for perfect colour-blind accessibility. Proof that you don't need Illustrator for publication-grade radial plots. #RStats #DataViz #GenAI
1
1
2
149
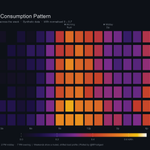
Who says heatmaps have to be boring? 🔥 Built this 100% in R using the excellent #ggplot2. The secrets to the aesthetic: 1️⃣ A custom dark theme & indigo-to-gold color ramp 2️⃣ width = 0.88, height = 0.84 in geom_tile() for the clean gaps 3️⃣ coord_cartesian(clip = 'off') for floating text #RStats #DataViz #DataScience
4
84
RProDigest | R Programming & Data Science retweeted
🚀 Best practices for R — all in one cheat sheet. From clean code to visualization workflows: r-best-practice #rstats #rmarkdown #quarto #tidyverse #ggplot2 #dataviz
1
57
3
291
14,608
If you know, you know. tidyverse::tidyverse_packages(include_self = FALSE) #RStats #DataScience #Tidyverse #Programming #CleanCode #DataAnalytics
70
Built this chart in ggplot2. But the lesson is bigger than code: 1. Explore early. 2. Specialize wisely. 3. Exploit compounded advantage later. #ggplot2 #reinforcementlearning #mathworks
93
RProDigest | R Programming & Data Science retweeted
Just testing out my material in Posit.cloud for my Introduction to Using R as a GIS course coming up on 28 & 29 April nickbearman.com/training-cou…. Posit.cloud is a great way of running R if you can't install it yourself! More details at nickbearman.com/installing-s…
5
52
326
12,894
For those that know, R is one of the best languages ever written, the genius of Ross & Robert is grossly under estimated. R has allowed me to do amazing stuff that would take several lines of code to do in SQL and other languages... Thats even before we talk about the amazing TidyVerse #Tidyverse
50
Using #Gapminder dataset, I tracked Asia's journey from 1952 to 2007. Look at the teal flow (using the Okabe-Ito palette for accessibility). Asia had a massive leap! 🌏📈 🗓️ 1952: A huge segment was trapped in <45 yrs life expectancy & <$1k GDP. 🗓️ 2007: That same flow surged into the 60-74 age bracket & $5k-$15k income tier. The Tech: Built this in #RStats using {easyalluvial} & {parcats}. Absolute credit to the creators of these two packages and thanks to @JoachimSchork for the highlight! 💻 Code: tinyurl.com/mvnhhhm7 #DataScience #DataViz #RStats #GlobalDevelopment
60
We are hitting a "Sophistication Wall" in AI evaluation. 🧱Most new benchmarks (GPQA, AgentBench) are pushing into the high-design quadrant, but look at the "High Utility Frontier" it’s nearly empty. Are we benchmarking for real-world use, or just for technical bragging rights? Thoughts? 👇#Rstats #Tidyverse #ggplot2
72