

11-year ecommerce operator — paid ads × marketplaces × SEO. Cross-border seller. I share real numbers and playbooks, not guru talk.
Taipei, Taiwan
Joined July 2011
- Tweets2.7K
- Following3.9K
- Followers734
- Likes5K


UPS and FedEx both say 5.9%. Your shipping bill won't rise 5.9%.
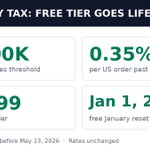
UPS daily rates +5.9% from Dec 21. FedEx list rates +5.9% from Jan 4. DHL +5.9% from Jan 1.
The surcharges climb faster:
• UPS residential $6.50 → $7.10
• FedEx extended residential $8.80 → $9.60
• UPS additional handling now bills at 50 lb, up from 40 lb
Re-run your per-order shipping cost before Dec 21, not after the holiday returns start landing.

5
Shopify calls this the first holiday where AI-assisted shopping goes mainstream. The base is still small and undisclosed, so don't over-read the multiples. But the work is the same either way: clean catalog data in, recommended listings out.
2
What I'd check before Black Friday week: product titles that say what the thing is, real specs in the description, GTIN where you have it, shipping and returns written out. That's the data the AI reads when it picks one listing over another.
1
2
Same call, the number that matters for sellers: catalog-powered AI searches convert about 2x better than AI working from scraped web data. The assistant recommends what it can read cleanly. Your feed is the pitch.
1
3
Shopify said it on the Nov 3 earnings call: AI traffic up 2.6x year over year, AI orders up 3.3x. AI channels send shoppers straight to a product page at 3x the rate of organic search. They land pre-sold.
1
6
AI shoppers convert 64% better than Google search visitors on Shopify stores. Traffic is up 2.6x, orders 3.3x. The gap isn't the AI. It's whose product data it reads. 🧵

2
14
Your move: open Merchant Center today and check your top 20 sale SKUs. sale_price plus sale_price_effective_date, 10% or more, nothing cheaper in the last 60 days. The badge is free. The feed work is the price.
4
So a sale that runs all of November won't show it until its last week. And if you ran a deeper discount in early October, your Black Friday price isn't the 60-day low, so no badge. Google also banned dates in promotion titles the same week. Dates go in the date fields only.
1
5
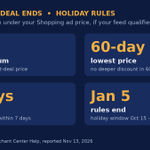
Holiday rules, Oct 15 to Jan 5: at least 10% off, the lowest price that item has had in 60 days, and the deal must end within 7 days. One more catch: 60 days between badges on the same product. Black Friday gets the badge, Christmas doesn't.
1
5
Google dropped the experimental label on its Deal Ends annotation on Nov 13. It builds automatically from your sale_price and sale_price_effective_date. No switch to turn it on. No switch to turn it off.
1
6
Google will put "3 days left" under your Shopping ad price for free. The catch: 10% off, your 60-day lowest price, and the deal must end within 7 days. 🧵

1
11
Your move: pull one real order shipped after Nov 2 and check the surcharge line reads 2% of the fulfilment fee. Then re-run margin on your top 10 EU SKUs with it in. Half a point is only small until volume does the math.
6
The surcharge stacks on peak fees too. Peak fulfilment fees run Oct 15 to Jan 14. Amazon calls the surcharge temporary and gives no end date, so do not model it away in January.
1
8
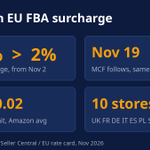
It is a percentage of the fulfilment fee, not the sale price. Amazon's own estimate is about 0.02 euros extra per unit on average. Trivial per unit. At that average, 10,000 units is 200 euros.
1
8
The fuel and logistics surcharge on EU FBA fees went from 1.5% to 2% on Nov 2. Ten stores: UK, France, Germany, Italy, Spain, Poland, Sweden, Netherlands, Ireland, Belgium. Multi-channel fulfilment followed yesterday, Nov 19.
1
10
Amazon raised a fee by half a point this month. 1.5% to 2% sounds like nothing. Then Black Friday week multiplies it by every unit you ship. 🧵

1
1
15
Your move: stop counting rankings. Pull your top 20 informational pages in Search Console and watch clicks, not position. If the Overview owns the answer, that page is a brand billboard now, not a traffic source. Write for the buy, not the browse.
6
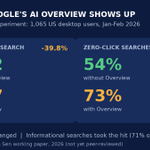
The hit lands on informational searches, 71% of the sample. Transactional searches showed no clear drop. Honest caveat: working paper, not peer-reviewed, desktop only. But the direction matches Pew's 2025 logs: 8% click-through with a summary vs 15% without.
1
9
Zero-click searches jumped from 54% to 73% when the Overview appeared. Ad clicks didn't move. Google keeps its revenue. Your content pays for it.
1
8