

Quantpedia - The Encyclopedia of Quantitative&Algo Trading Strategies - we process academic research into trading ideas ... Risk Disclosure: https://xitter.cf/t.co/8FW3jOfZUc
Joined April 2018
- Tweets794
- Following415
- Followers6K
- Likes351






Bitcoin Runs on a Clock: Why Every Price Indicator Dies and the Halving Clock Doesn’t
For anyone trading or investing in Bitcoin, a familiar indicator can become a dangerous comfort blanket. Josh Molnar’s Bitcoin Runs on a Clock argues that classic cycle signals—such as MVRV, the Mayer Multiple and Pi Cycle Top—have weakened as Bitcoin’s price swings become less extreme. Thresholds calibrated to earlier cycles may consequently stop triggering, leaving investors waiting for a sell signal that never arrives. The practical takeaway is that a strong historical record does not make an indicator’s settings permanent. If the market changes, the dashboard needs to change with it.
quantpedia.com/bitcoin-runs-…
#bitcoin #halving #quant #analysis #investment #trading #strategy

Does More History Help? A Market-Regime HMM and the Trouble with Out-of-Sample Evaluation
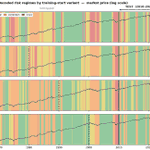
This article investigates whether longer historical training periods improve the out-of-sample performance of a Hidden Markov Model (HMM) used for identifying financial market regimes. Four four-state Gaussian HMMs are compared, differing only in the starting point of their training data (1970, 1980, 1990, and 2000), while being evaluated on the same test period. The model uses five market-based features capturing volatility, drawdowns, credit conditions, and sector rotation to identify latent risk regimes.
The results show that selecting models solely by out-of-sample likelihood can lead to misleading conclusions, favoring shorter training histories that fail to capture crisis regimes. When evaluated using regime stability, economic interpretability, and strategy-based metrics, the model trained on the longest history provides better generalization and avoids overfitting.
The study highlights that validation methodology and evaluation criteria are as important as model design and data length when assessing regime-based investment models.
quantpedia.com/does-more-his…
#HMM #market #timing #risk #regimes #model #quant #trading

Hello all,
With autumn underway, we’d like to share the latest developments at Quantpedia.…
– Screener and API extended with two new fields: Transaction Costs and Robustness
– 11 new Quantpedia Premium strategies
– 7 new related research papers
– 8 new backtests
– and finally, 6 new posts on our Quantpedia blog
quantpedia.com/quantpedia-in…

Trading the Multi-Asset Drift Around U.S. Elections
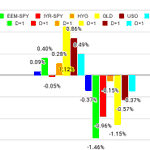
We analyze a multi-asset calendar anomaly around U.S. federal elections that is consistent across assets and simple to trade. While our previous study documents a robust pre-election drift, the cross-asset pricing of its D+1 resolution remains unmapped beyond SPY. Using a diversified ETF basket spanning technology, emerging markets, real estate, high-yield credit, gold, oil, and foreign exchange, we show that election day itself is neutral to slightly positive — an equal-weight D0 long earns a modest 1.03% p.a. at a Sharpe of 0.19, which we document as the control arm of the experiment but do not trade — while the following session delivers a systematic sell-off across all seven legs as the political uncertainty premium collapses. An equal-weight short on D+1 yields 1.86% per annum with a Sharpe of 0.31 and a maximum drawdown of -4.16%, achieved over 13 trading days in 26 years. Intermediate Treasuries exhibit the inverse pattern, selling off in the four days before the vote and rallying from D0 to D+2, with a Sharpe of 0.48.
quantpedia.com/trading-the-m…
#election #stock #market #timing #trading #strategy #trump #quant #algo

A Century of Meme Stocks and the Price of Coordination
Meme stocks are commonly studied through social-media activity, but this approach limits both the historical scope of research and the signals available to practitioners. In A Century of Meme Stocks and the Price of Coordination, Chad Schmerling develops an alternative: a machine-learning model trained to identify the holdings of the Roundhill MEME ETF using market and firm-level data rather than textual inputs. By adapting the feature set to historical data availability, the paper constructs a measure of “memeness” extending back to 1926. For traders and portfolio managers, its principal contribution is a framework for identifying speculative activity and examining how its return implications vary with the investment horizon.
quantpedia.com/a-century-of-…
#meme #bubble #fomo #stocks #quant #algo #trading #strategy #analysis

A New Stage, a New Deadline: Quantpedia Awards 2027 Are Here Again!
Quantpedia Awards 2027 are here — with over $25,000 in prizes and a bigger stage for outstanding quant research! In partnership with The Data Driven Market Show, we’ll announce the winners live on stage at Future Alpha 2027, during the conference on March 16–17, 2027, putting their work in front of the global quantitative investing community.
Compete for cash awards, education, research tools, and industry recognition — but note the earlier submission deadline: December 31, 2026, at 23:59 UTC.
quantpedia.com/a-new-stage-a…
#quant #algo #trading #research #competition #quantpedia #awards

Can Weakening Morning Order Flow Predict SPY Reversals?
In a previous article Building and Testing Trend-Following Strategies on One-Minute SPY Data, we investigated whether retail activity indicators derived from one-minute SPY data could be used to construct profitable trend-following strategies. The results suggested that we are able to construct strategies that are often able to achieve superior risk-adjusted performance. In this article, we examine an alternative hypothesis. Instead of assuming that changes in retail activity signal the continuation of an existing trend, we investigate whether persistent declines in order flow may create conditions for a subsequent market reversal. More specifically, we analyze situations in which selected trading activity indicators decrease for several consecutive trading days and evaluate whether such sequences are followed by above-average SPY returns.
quantpedia.com/can-weakening…
#intraday #extended #alternative #dataset #quant #algo #trading #strategy #reversal #equity #market #timing #orderflow #activity

Building and Testing Trend-Following Strategies on One-Minute SPY Data
Intraday trading strategies have gained increasing attention as advances in computing power and market data availability have made intraday strategy analysis more accessible. While many trading strategies are traditionally developed and evaluated using daily price data, shorter timeframes can provide additional opportunities to identify and exploit market trends within a single trading session. In this article, we investigate the performance of trend-following strategies based on selected technical indicators computed from one-minute price data for SPY ETF. The historical dataset, provided by Algoseek, serves as the basis for designing, backtesting, and comparing several intraday trading approaches.
quantpedia.com/building-and-…
#intraday #extended #alternative #dataset #quant #algo #trading #strategy #trendfollowing #equity #market #timing #retail #activity

Do Airline Stocks Take Off Around U.S. Holidays?
Holidays put people in motion. In the days surrounding major U.S. holidays, airports become busier as travelers visit their families or take advantage of extended weekends. Financial markets themselves are known to display a holiday-related seasonality. In our previous research on the Pre-Holiday Effect in Commodities, we identified a short-term price drift in crude oil and gasoline before major U.S. holidays. Increased travel and the associated expectation of higher fuel consumption offered one possible explanation. This naturally raises another question: if holiday travel leaves a seasonal footprint in energy markets, can it also be detected in the stocks of the airlines transporting those travelers? To investigate this possibility, we analyze the performance of the U.S. Global Jets ETF (JETS) around major U.S. holidays. We first examine its daily returns from ten trading days before to ten trading days after each holiday and use the resulting return profile to identify the strongest seasonal windows. We then formulate two directional JETS strategies and a JETS–USO strategy.
quantpedia.com/do-airline-st…
#holiday #seasonal #quant #trading #strategy #jets #uso #etf

From Barrier Crossings to Terminal Distributions: A Skellam-Based Options Pricing Framework for 0-DTE Markets
The explosive growth of hyper-liquid 0-DTE markets has pushed traditional options pricing infrastructure to its breaking point, as continuous Black-Scholes calculus can collapse into an unusable point mass at expiration. Rather than patching a broken formula with hand-fitted tweaks, a new paper suggests dismantling legacy math by replacing continuous geometric Brownian motion with a discrete, order-book-driven structural layer. Instead of smoothing over intraday price action, this model captures the raw physical reality of high-frequency liquidity by deriving a closed-form framework where the implied volatility surface is built directly from actual market microstructure.
quantpedia.com/from-barrier-…
#0DTE #options #trading #pricing #quant #algo #strategies

Quantpedia in August 2026
Hello all,
We hope you had a great end to the summer, whether August meant a final holiday or a return to the office. Here’s a quick recap of the latest developments we prepared for Quantpedia in the last days of summer…
– new report in the Live Strategies section called Composite Analysis
– 11 new Quantpedia Premium strategies
– 5 new related research papers
– 8 new backtests
– and finally, 5 new posts on our Quantpedia blog
quantpedia.com/quantpedia-in…
#quant #algo #live #trading #strategies #backtesting

Do LLM "Crowds" Produce Investment Signals? An Empirical Test
The integration of artificial intelligence into algorithmic trading has ignited a race to transform generative text into systematic alpha. A new paper written by Steven Edwards empirically investigates whether constructing a synthetic consensus using large language models can simulate information aggregation dynamics or if it merely acts as a sophisticated echo chamber. By utilizing an expansive framework to evaluate portfolio construction across distinct synthetic mandates, the study challenges whether generative agents can truly democratize the wisdom of crowds within highly efficient capital markets.
quantpedia.com/do-llm-crowds…
#trading #strategy #LLM #agents #quant #AI #signals

Why Average Strategy Performance Can Mislead Portfolio Research
Average strategy performance is one of the most common shortcuts in portfolio research. It gives the researcher a clean benchmark, a single reference line, and a simple way to compare one strategy against a broader group of similar strategies. In many cases, this is useful. But it can also be misleading.
The problem is that an average hides dispersion. Two peer groups can have the same average return, but the internal structure of those groups can be completely different. In one year, nearly all strategies may behave similarly and cluster around the median. In another year, the same average may hide a wide spread between winners and losers. For portfolio construction, this distinction matters.
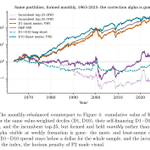
This case study shows how Quantpedia API can be used to go beyond the average peer group return and measure yearly performance dispersion across a group of trend-following strategies. The goal is not only to ask how the average strategy performed, but also how different the individual strategies were from each other.
quantpedia.com/why-average-s…
#benchmarking #trendfollowing #trading #strategies #peer #group

Boundaries of Time Series Momentum
Time-series momentum stands as one of the most reliable and heavily backtested anomalies in quantitative finance, serving as a foundational alpha source for modern managed futures and trend-following strategies. However, a recent academic paper by Matti Suominen and Erik Hjalmarsson, titled “Boundaries of Time Series Momentum,” uncovers a structural vulnerability that every practitioner must account for. The authors demonstrate that while equity market trends persist reliably during normal business cycles, they systematically break down and aggressively reverse when market valuations reach historical extremes. This phenomenon establishes clear macro “boundaries” where chasing the trend shifts from a highly profitable strategy to a severe drawdown risk.
quantpedia.com/boundaries-of…
#momentum #trendfollowing #reversal #valuation #CAPE #bubble #managed #futures

Quantpedia API for Peer Group Strategy Analysis
A single backtest can show that strategy was profitable, but it does not always show whether the strategy was competitive. This is especially true for systematic futures strategies. A trend-following strategy can have a positive Sharpe ratio, a long live-like performance history, and a reasonable drawdown, but those numbers are difficult to interpret without a relevant comparison group.
A broad equity index is often not the right benchmark for this type of strategy. A monthly rebalanced multi-asset futures strategy has a different objective, different risk profile, and different return drivers than a long-only stock index. A more useful question is whether the strategy performs well compared with other systematic trend-following futures strategies.
This case study shows how the Quantpedia API can be used to build a custom peer group benchmark for strategy evaluation. The workflow has two steps. First, Quantpedia strategy metadata is used to screen and define a comparable peer group. Second, the historical equity curves of the selected strategies are downloaded, converted into daily returns, and aggregated into an equal-weighted peer group benchmark.
quantpedia.com/quantpedia-ap…
#peers #managedfutures #cta #trendfollowing #api #quant #trading #strategy #benchmark

Sectoral Intramonth Momentum Cycle: Exploiting Turn-of-the-Month Patterns in Sector ETF Strategies
We document a persistent intramonth momentum cycle in U.S. sector ETFs that yields meaningful risk-adjusted returns when properly sequenced. Using the nine original Select Sector SPDR ETFs and SPY as the market benchmark from December 1998 through June 2026, we show that trailing 252-day sector momentum generates a positive spread on the first trading day of the month—and then sharply reverses on days two and three. A third, independent leg of the cycle emerges in the window from ten to five trading days before month-end, consistent with the intramonth momentum cycle recently documented at the single-stock level by Nathan, Suominen and Tasa (2026). Stitching the three legs together into a single composite strategy delivers 5.99% annualized return at a 0.55 Sharpe ratio for the long-short variant, and 3.77% at 0.54 for the market-neutral variant—all while being invested fewer than half the trading days each month. Our contribution is twofold: we extend the calendar-anomaly literature from individual equities to sector-level portfolios, and we provide practitioners with a transparent, low-turnover framework that translates these academic patterns into actionable trade schedules.
quantpedia.com/sectoral-intr…
#momentum #reversal #turn-of-the-month #calendar #trading #strategy

Hello all,
We hope you're enjoying the middle of summer. Here's a quick recap of the latest improvements and additions we've prepared for Quantpedia during the past month
– API users can now directly download the full research papers written by Quantpedia
– 10 new Quantpedia Premium strategies
– 2 new related research papers
– 7 new backtests
– and finally, 5 new posts on our Quantpedia blog
quantpedia.com/quantpedia-in…
#quant #trading #strategies #alternative #data #api

Is Trend Still Your Friend?: A Microstructural Account of the Demise of Short-Term Trend-Following
Trend following was one of the most persistent anomalies in finance for nearly two centuries, yet its performance deteriorated sharply after the 2008 financial crisis. An analysis of approximately 100 liquid futures contracts from 1995 to 2025 shows that this decline is highly selective. The decisive factor is not asset class, liquidity, market electronification, or strategy crowding, but volatility-normalized tick size. After 2008, trend-following profits collapsed almost entirely on small-tick contracts across all signal horizons, while remaining largely intact on large-tick contracts. This finding suggests that modern trend-following portfolios are fundamentally split into two distinct regimes governed by market microstructure rather than traditional asset classifications.
quantpedia.com/is-trend-stil…
#trendfollowing #hft #microstructure

From Backtest to Benchmark: Validating New Strategies with Quantpedia API
A profitable backtest is rarely the end of a research process. In professional quantitative research, the more important question often comes after the first positive result: is the strategy genuinely new, or is it simply another version of an already known factor, timing rule, or anomaly?
This is especially relevant when a researcher develops a new systematic strategy with a clean historical equity curve. The strategy may have acceptable risk-adjusted performance, stable drawdowns, and a logical trading rule, but those statistics alone do not prove that the idea is unique. A silver strategy, for example, may look different on the surface while still behaving like a known commodity timing model, a trend-following strategy, a volatility filter, or a broader macro factor exposure.
This article shows how Quantpedia API can be used as a benchmark dataset for validating new research. Instead of evaluating a new backtest in isolation, the strategy is compared against the Quantpedia universe of documented quantitative strategies. The workflow identifies nearest neighbours, assigns the strategy to a factor cluster, calculates a uniqueness score, and produces a research robustness report that can be used for deeper validation.
The goal is not to replace human research judgment. The goal is to create a structured robustness checker that helps researchers understand whether a new strategy is truly differentiated, redundant with known effects, or simply a variation of an existing Quantpedia strategy profile.
quantpedia.com/from-backtest…
#quantpedia #api #backtesting #benchmarking #clustering #peers #trading #strategies

Getting the Target Right in Return Prediction
Recent interesting research from Cakici and Zaremba, highlights an often-overlooked aspect of machine learning for equity return prediction: the choice of prediction target. Rather than focusing on increasingly sophisticated model architectures or feature engineering, the authors show that how returns are represented during training has a much larger impact on predictive performance. In particular, models trained to predict stock ranks instead of raw return levels generate substantially stronger portfolio performance—roughly doubling both returns and Sharpe ratios in large-cap universes.
quantpedia.com/getting-the-t…
#machinelearning #ai #quant #factor #investing #stockpicking
