
I am a dad of two kids, a husband to a wonderful woman and a Canada Research Chair in Political Methodology at Western University.
- Tweets8
- Following28
- Followers107
- Likes6
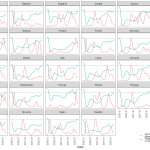


ALT This is a line plot where each panel shows data for a different European country. The x-axis is Date (year-month) and there are two y-axis series. The first is covid deaths per million rescaled into the range [0,1] by dividing each monthly death total by the maximum deaths per million in each country. The second series is flight arrivals divided by the monthly pre-pandemic average (using data from 2016-2019). Countries return to pre-pandemic flight arrival levels at different rates. Greece returned to pre-pandemic arrival levels in the middle of 2021. Sweden, on the other hand, is still only at around 73% of pre-pandemic levels. Seeing the two series together, it is not obvious that changes in flight arrivals are being manipulated based on Covid deaths.

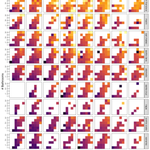
ALT The figure provides a heat map of average price by number of bedrooms and number of bathrooms for each of the years between 2011 and 2018, inclusive for each of the 10 counties around (and including) San Francisco. Rents increase with bedrooms and bathrooms (on average), not surprisingly, but another trend is the decreasing number of rental opportunities on Craigslist, particularly in counties that have lower rents.

ALT These are choropleth maps of the United Kingdom's postal areas. They are filled in proportional to the average hourly pay differential between men and women by the size of employer (6 categories from less than 250 to 20,000 or more). Larger differences seem to appear generally in the north and west of the country. The data come from the 6-28-2002 TidyTuesday challenge. The map data come from Edinburgh Data Share at the University of Edinburgh.