

The research warehouse your AI can drive. Decades of verified data, backtests in seconds. https://xitter.cf/t.co/uABcuIFNSZ
Joined September 2026
- Tweets275
- Following76
- Followers129
- Likes20




Pinned Tweet
Every US stock, graded A+ to F against the whole market, regraded monthly.
The A stock-months ran +31% a year after the weights were locked; the F months lost 8.8%. No stock has ever earned the A+.
The research warehouse your AI can drive: quantgpt.co

$ANT, Anthropic, priced its IPO at $83 and Wall Street's targets already reach $155.
So how did the biggest debuts do in year one?
We tracked 36 since 2010 that traded $2 billion or more on day one. A year later, 29 were below their first-day close.
xitter.cf/DeItaone/status/212337…


$ANT - WALL STREET TURNS BULLISH ON ANTHROPIC WITH PRICE TARGETS UP TO $155
Four Wall Street firms initiated bullish coverage following Anthropic's $83-per-share IPO pricing, projecting substantial upside.
🔸 Citizens: Market Outperform — $125 (+51%)
🔸 Wolfe Research: Outperform — $135 (+63%)
🔸 Needham: Buy — $150 (+81%)
🔸 Melius: Buy — $155 (+87%)
Needham forecasts 150%+ revenue growth in FY2027, with potential 90%+ gross margins and 35%+ operating margins.
Melius sees long-term earnings power exceeding $5 per share, supported by AI adoption and declining computing costs.
Citizens highlights Anthropic's multi-chip infrastructure, strong founding team and Claude-driven software development.
2
65

That's every IPO and direct listing that size with a full year of trading, pulled in one query. Median: about 28% below the first-day close.
The 2025 class (CRCL, FIG, BLSH, KLAR)? All 4 lower.
The 7 winners? Three more than doubled: ARM, PLTR, RDDT.
Not investment advice.
39
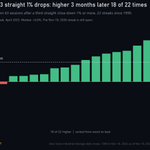
$DJI closed down 1% or more three days in a row through yesterday.
So what usually follows a streak like that?
It's happened 22 times since 1990. Three months later the Dow was above its close on that third down day after 18 of them.
xitter.cf/DeItaone/status/212344…

2
1
29
We ran every streak like it back to 1896 in one query.
Before 1990 it was a coin flip: higher three months later 39 of 76 times.
Since 1990: 18 of 22, with a median gain of about 7% from that third close.
The misses? 1990, 2002, 2008 and 2018.
Not investment advice.
6

We pulled every day since 2005 with the index 5%+ off its high and just 1 member at a 52-week high.
120 cases, across 21 selloffs. A year later the lone leader trailed the S&P 500 in 82.
DRI was one in April 2009: up 27% a year on. The S&P 500: up 42%.
Not investment advice.
5

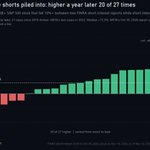
Lightly shorted: 5.5% of the time.
We pulled every S&P 500 and S&P 400 report since 2018 in one query: 1,929 with 10%+ short.
Which way? 271 jumps of 10%+, 211 drops.
DKS, 17 reports with 10%+ short: 5 jumps, 1 drop.
Run your own on quantgpt.co
Not investment advice.
8

The median move on that next report: down about 5%.
Every DELL pop was 15%+. Only EXPE in 2012, NFLX in 2015 and AXON in 2025 also had 3 pops of 15%+ in a row.
AXON popped again. The other 2, EXPE and NFLX, fell.
Run your own on quantgpt.co
Not investment advice.
10

Which way? A coin flip: 62 jumped 10%+, 59 dropped 10%+.
We sorted every S&P 500 report since 2010 by distance from the high, in one query.
INTU has been here twice, both this year: up about 4% in February, down 20% in May, its worst since 2010.
Not investment advice.
7

We pulled every 20% drop in MTUM since its 2013 launch in one query.
A year after those 4 began, it was higher 3 times. Median of all 4, the miss included: about 41%.
The miss? 2022, when the S&P 500's drop was the smallest of the 4, about 12%.
Not investment advice.
4
$LOW beat on Q3 and raised its sales outlook. HD fell about 2% on its report Nov 17.
Does a bad HD report drag LOW down? History says no.
Since 2011, HD fell 2%+ on its report the day before LOW's report, 10 times. LOW rose on report day 7 of those 10.
xitter.cf/wallstengine/status/21…


LOWE'S $LOW Q3’26 EARNINGS HIGHLIGHTS
🔹 Revenue: $22.8B (Est. $22.41B) 🟢; +9.3% YoY
🔹 Adj. EPS: $3.10 (Est. $2.88) 🟢; +1.3% YoY
🔹 Comparable Sales: +1.8% (Est. 0.4%) 🟢
🔹 Gross Margin: 32.95% (Est. 33.07%) 🔴
FY26 Guide:
🔹 Revenue: ~$92.5B (Est. $92.09B) 🟢; from $92.0B
🔹 Adj. EPS: ~$12.25 (Est. $12.28) 🔴
🔹 Comparable Sales: +0.5%; from flat
🔹 Operating Margin: 11.1%; from 11.2%
🔹 Adj. Operating Margin: 11.5%; from 11.6%
🔹 Net Interest Expense: ~$1.5B; from $1.6B
Other Q3 Metrics:
🔹 Online Sales: +17.4%
Key Updates:
🔹 IEEPA Tariff Refunds: +$0.34 impact on diluted and adjusted EPS
🔹 Acquisition-related intangible asset amortization: $96M pre-tax expense
🔹 Dividends Paid: $701M
Comments:
🔸 “We just delivered our sixth consecutive quarter of positive comp sales driven by continued growth across Pro, Online and Home Services. These results reflect the resiliency of our Total Home strategy.”

2
47