





Pinned Tweet
I’m not being bearish on #Bitcoin - just following the cycles.
$BTC has followed a near perfect rhythm for 15 years: ~1,064 days up -> ~364 days down
Here are the exact highs, lows, durations, and % changes 👇
🟢 Cycle 1
2010-03-17 ATL $0.003 (BitcoinMarket)
449 days
2011-06-08 ATH $31 (Mt.Gox) +1,033,000%
163 days
2011-11-18 ATL $2.01 (Mt.Gox) -93%
743 days
🟢 Cycle 2
2013-11-30 ATH $1,163 (Bitstamp) +57,800%
410 days
2015-01-14 ATL $152 (Bitstamp) -87%
1,068 days
🟢 Cycle 3
2017-12-17 ATH $20,093 (BitMEX) +13,123%
363 days
2018-12-15 ATL $3,121 (BitMEX) -84%
1,061 days
🟢 Cycle 4
2021-11-10 ATH $69,182 (Bybit) +2,116%
376 days
2022-11-21 ATL $15,437 (Bybit) -78%
1,050 days
🟢 Cycle 5 (current)
2025-10-06 ATH $126,197 (Bybit) +717% ✅
If the rhythm continues:
364 days
Next ATL => 2026-10-05 at $31,550 (-75%)
1064 days
Next ATH => 2029-08-03 at $250,000 (+700%)
Since 2015, Bitcoin’s macro rhythm has been almost clockwork:
3 years up -> 1 year down -> halving in between.
Not a prediction - just math and time.

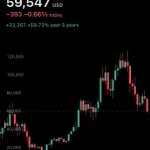
Was $57,647 $BTC bottom? Maybe. But the timing was not there.
324 days since $126,197 ATH.
The cycle points to around 364 days from top to bottom.
That leaves 40 days.


I’m not being bearish on #Bitcoin - just following the cycles.
$BTC has followed a near perfect rhythm for 15 years: ~1,064 days up -> ~364 days down
Here are the exact highs, lows, durations, and % changes 👇
🟢 Cycle 1
2010-03-17 ATL $0.003 (BitcoinMarket)
449 days
2011-06-08 ATH $31 (Mt.Gox) +1,033,000%
163 days
2011-11-18 ATL $2.01 (Mt.Gox) -93%
743 days
🟢 Cycle 2
2013-11-30 ATH $1,163 (Bitstamp) +57,800%
410 days
2015-01-14 ATL $152 (Bitstamp) -87%
1,068 days
🟢 Cycle 3
2017-12-17 ATH $20,093 (BitMEX) +13,123%
363 days
2018-12-15 ATL $3,121 (BitMEX) -84%
1,061 days
🟢 Cycle 4
2021-11-10 ATH $69,182 (Bybit) +2,116%
376 days
2022-11-21 ATL $15,437 (Bybit) -78%
1,050 days
🟢 Cycle 5 (current)
2025-10-06 ATH $126,197 (Bybit) +717% ✅
If the rhythm continues:
364 days
Next ATL => 2026-10-05 at $31,550 (-75%)
1064 days
Next ATH => 2029-08-03 at $250,000 (+700%)
Since 2015, Bitcoin’s macro rhythm has been almost clockwork:
3 years up -> 1 year down -> halving in between.
Not a prediction - just math and time.
1
208
Everyone says this cycle is different.
Maybe.
But every cycle people also said we would never see another 80% Bitcoin bear market.
2013-15: -87%
2017-18: -84%
2021-22: -78%
If drops continue getting smaller, here’s what they look like from the $126,197 top:
-55% -> $56.8k
-60% -> $50.5k
-65% -> $44.2k
-70% -> $37.9k
-75% -> $31.5k
I’m not saying that’s where $BTC has to go.
I’m saying people also said we would never lose 2021 ATH.

1
78
$MSTR is basically Saylor borrowing a pile of money to buy Bitcoin. That’s the whole story. So when you buy the stock, you’re not really buying a company. You are making Bitcoin bet with a bunch of extra risk stapled on.
Here’s the part most people miss. Strategy owns about $62B in Bitcoin, but it owes around $21B.
The lenders and preferred holders get paid first. You, the shareholder, get whatever’s left over. And since that $21B debt doesn’t shrink when Bitcoin drops, the losses pile onto your end. That’s the catch: when Bitcoin falls 10%, your stock can fall 20-30%.
It works in reverse on the way up too, which is the whole appeal, but right now we’re talking about the downside.
Are you overpaying today? A little, yeah.
If you do the math and strip out the debt, your actual slice of the Bitcoin is worth about $116 / share. The stock costs $159.09. So you’re paying roughly 27% extra for the hype.
Now the scary part -> What Bitcoin drop does to you:
$BTC vs $MSTR roughly:
$73.5k (now) -> $159.09
$60k -> $75–105
$50k -> $48–75
$40k -> $28–48
$30k -> $8–25
Look at that first drop. Bitcoin only has to fall about 18% (to $60k) and $MSTR could get cut roughly in half. The deeper Bitcoin goes, the uglier it gets, because that fixed debt eats a bigger and bigger chunk of what’s left.
So here’s where I would leave it:
You’re paying a premium price and taking double the risk (Bitcoin falling plus that premium melting away).
If all you really want is a Bitcoin bet, just buy $BTC. If you specifically want $MSTR, $159.09 is an expensive place to step in. Waiting for it to dip toward the $104-120 area gets you a far better deal and some breathing room.
None of this is financial advice, just the math in plain terms.

260 days since $BTC ATH.
If the cycle is still valid, there are 102 days left until the low.
People spend all bear market watching the price, but if you’re smart you should be watching the calendar.
I’m not being bearish on #Bitcoin - just following the cycles.
$BTC has followed a near perfect rhythm for 15 years: ~1,064 days up -> ~364 days down
Here are the exact highs, lows, durations, and % changes 👇
🟢 Cycle 1
2010-03-17 ATL $0.003 (BitcoinMarket)
449 days
2011-06-08 ATH $31 (Mt.Gox) +1,033,000%
163 days
2011-11-18 ATL $2.01 (Mt.Gox) -93%
743 days
🟢 Cycle 2
2013-11-30 ATH $1,163 (Bitstamp) +57,800%
410 days
2015-01-14 ATL $152 (Bitstamp) -87%
1,068 days
🟢 Cycle 3
2017-12-17 ATH $20,093 (BitMEX) +13,123%
363 days
2018-12-15 ATL $3,121 (BitMEX) -84%
1,061 days
🟢 Cycle 4
2021-11-10 ATH $69,182 (Bybit) +2,116%
376 days
2022-11-21 ATL $15,437 (Bybit) -78%
1,050 days
🟢 Cycle 5 (current)
2025-10-06 ATH $126,197 (Bybit) +717% ✅
If the rhythm continues:
364 days
Next ATL => 2026-10-05 at $31,550 (-75%)
1064 days
Next ATH => 2029-08-03 at $250,000 (+700%)
Since 2015, Bitcoin’s macro rhythm has been almost clockwork:
3 years up -> 1 year down -> halving in between.
Not a prediction - just math and time.
104
Crypto guys reading this and wondering why everyone is acting surprised.
People keep calling it the biggest IPO ever.
The setup looks a lot more familiar to anyone who’s trading low liquidity altcoins.

🚨 THIS MAY BE THE MOST MANIPULATED VALUATION THE STOCK MARKET HAS EVER SEEN.
Only 4% of SpaceX shares are actually trading right now.
The entire $2.5T valuation is being calculated from a tiny sliver of shares while 96% of the company remains locked up.
This is the stock market version of a crypto FDV scam.
In crypto, people separate:
• Circulating Market Cap
• Fully Diluted Valuation (FDV)
Because everyone knows a token with only 4% circulating supply can look massively overpriced once the rest unlocks.
SpaceX right now is being valued almost entirely on its FDV.
The real “circulating” value of SpaceX is closer to $90-120 billion based on the actual tradable float.
And the craziest part?
The rules were literally changed right before the IPO.
Nasdaq removed its 10% float requirement.
Cut seasoning periods to 15 days.
And added special float multipliers that massively boosted SpaceX’s index weight.
Then trillions of dollars in passive ETFs were forced to buy the stock regardless of valuation.
That created artificial demand for an artificially tiny float.
Now look at the fundamentals.
SpaceX generated just $18.7B in revenue last year.
Amazon generated $717B.
Yet SpaceX briefly traded near Amazon’s valuation.
SpaceX is valued like the 4th largest company on earth while not even ranking inside the top 100 globally by revenue.
And unlike Nvidia, Microsoft, or Amazon:
SpaceX is currently LOSING money.
The company went from an $8B profit in 2024 to a $4.9B loss after absorbing xAI’s massive cash burn.
The stock is trading at roughly 110-130x sales.
The S&P 500 average is 3.5x.
Nvidia trades around 20x.
And this is where it gets dangerous:
The current float structure does not last.
Between August and December, the float could expand roughly 13x as insider lockups begin expiring.
That means billions of additional shares may eventually hit the market after the current price was established using only 4% supply.
Crypto investors have seen this movie many times before.
And what comes after that is always a CRASH.


55

$SPCX ripped to $176.52
Exactly what happens when everyone wants in and nobody wants out.
The interesting part comes later.
Every memecoin looks unstoppable before the early holders start taking profits.
Everyone is calling $SPCX the greatest IPO ever.
Maybe.
But the setup looks suspiciously familiar to anyone who survived a few memecoin cycles.
Hear me out 👇👇👇👇👇
42
That’s why I think a lot of people are about to confuse price discovery with value.
If $SPCX pumps 50-100% or more after launch, that doesn’t mean the company suddenly became worth hundreds of billions more overnight.
It means there weren’t enough shares available for everyone trying to buy.
👇
1
69
We’ve seen this movie before.
- Low liquidity.
- Massive narrative.
- Cult founder.
- Retail FOMO.
- Over-subscribed launch.
That’s basically the memecoin starter pack.
Funny part?
People laughing at crypto for years are about to experience their first low liquidity launch and call it investing.
Good luck out there.
1
43


242 days since the $BTC top.
Don’t believe any bottom callers.
There’s still 122 days left if the cycle stays on schedule.
IYKYK
239 days since the $BTC ATH of $126,197.
If the cycle sticks, 125 days left until $BTC bottoms out.
People still think every +10% bounce means new ATHs are coming.
This happens every bear market.
Small pumps convince people the bottom is in long before the actual bottom.

2
93
