Data + Viz at @BBGVisualData | @columbiajourn @ledeprog alum
- Tweets2.6K
- Following2.5K
- Followers2.6K
- Likes7.6K






ALT A graphic comparing China and India in the transiting of oil products through three maritime chokepoints, composed of a globe map centered on India. The three chokepoints are the Suez Canal, Strait of Hormuz and Strait of Malacca, each represented with an area chart in the trade proportion of China (in yellow), India (in cyan) and other countries, and a detail map, pointing back to the main map. Each has an annotation of how much oil products transit there (2018–23): Suez with 18.4 million total barrels/day, Hormuz with 90.1 million and Malacca with 96.8 million.

ALT Two close-up satellite maps with China’s Djibouti military base at the top and India’s in North Agalega Island, Mauritius. Each map contains annotations that outline important features of the bases. China’s Djibouti base is next to the Port of Doraleh terminals and contains suspected barracks, piers, a heliport, on the coast, about 1–2 km west of Camp Lemonnier, the main base of operations for US Africa Command. India’s Mauritius map is on a longiform island stretching west to east, shows a jetty on the west coast, and an airstrip along the length, with hangars.



ALT A detail map of Washington, D.C., around Union Station and just north of the National Mall, east of the White House, showing locations of federal office leases. About 30–40 locations are colored by status of lease: Terminated according to DOGE in orange, Expiring during Trump’s term in yellow and Expiring after Trump’s term in blue. Partially transparent circles color-coded by aforementioned categories are seen over the building, sized by total annual rent. Four locations in orange are annotated, with the highest rent one being $26.4M at 2 Massachusetts Avenue NE, directly west of Union Station.

ALT Pie charts representing, by US state, the share of space with leases terminated according to DOGE (in orange) or expiring during Trump’s term (in yellow), sized by leased office space, arranged in a cartogram of the US states. The largest by far are in the D.C., Maryland and Virginia (DMV) area, followed by California, Texas. Most terminations were in the DMV, but a sliver (less than 5% each) of the total. D.C. had the largest proportion of the three. Of other states, Georgia is visually one of the larger circles with a slightly larger proportion of orange and a note says that DOGE said that 203K square feet, or 5% of its total, were cut.


ALT A graphic composed of colored squares comparing the bonus by year for 6 US banks and 6 European banks from 2008 to 2023. The square size represents realized bonus value, and the color, from magenta to green, represents whether the bonus was lower (0 to 100%) or higher (100 to 200+%) than face value. The US side had generally more green since 2012, with the largest squares in 2012, 2019 and 2023. A note on that year said “Bonuses awarded in 2012 amounted to a larger number of shares, thanks to stock prices tanking after the European debt crisis. When those shares were sold in the following years – with prices rising again – the result was the highest realized bonus values in the period examined”. A note on 2023 for JPMorgan said “Bonuses awarded by JPMorgan have created a higher realized value for 14 out of 16 years”. Another pointing to the European banks in 2023 said “The realized value of European bank bonuses has increased recently, as their stock prices pick up”.


ALT Trump Organization golf properties represented as squares (14 visible ones), most with an image of the property set in them. The squares are arranged on a Y-axis by growth in revenue (2016–2023) and sized by 2023 revenue. All properties grew in revenue. The largest by far was Doral, Florida at $128M, at approximately +30%. A note on Doral says “The flagship resort in Doral, FL, generated about one-third of all income from golf properties for the Trump Organization in 2023”. The one that grew the most was Turnberry, Scotland, at $26M and around +125%. Bedminster, New Jersey was the second in revenue overall, with $29M, and grew around +90%.


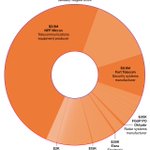
ALT A donut chart about Texas Instruments components bought by Russian companies, including entities tied to the military industry, between January and August 2024, for a total value of $5.9M. Half was from NPF Micran, a telecommunications equipment producer, with $2.9M. Another sizeable chunk (about 10% of the donut) was Fort Telecom, a security systems manufacturer, at $600K. Other smaller groups in the $2,000 to $35K range are noted: FGUP PO Oktyabr, a radar systems manufacturer, at $35K, Elara, an electronic equipment manufacturer, at $28K, NPP Mera, a developer of systems for aviation and rocket industries, at $15K, and finally NAMI, an automotive R&D, maker of Vladimir Putin’s favored luxury limousines, at $2,000.


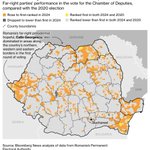
ALT A map of Romania by municipality, also known as commune-level subdivisions (total of about 3,200), about the performance of far-right parties in the vote for the Chamber of Deputies, compared with the 2020 election. The subdivisions were colored by the following key: orange for “rose to first-ranked in 2024”, yellow for “ranked first in both 2024 and 2020”, dark gray for dropped to lower than first in 2024 and light gray for ranked lower than first in both 2024 and 2020. The map had very little yellow (less than 10 subdivisions) and dark gray (less than 5) and was predominantly light gray, then orange. The orange was predominantly in the far-west, north-northeast and southeast border counties. A note pointing to these border regions reads “Romania’s far-right presidential hopeful, Calin Georgescu, also dominated in areas along the country’s northern, western and eastern borders in the first round of voting”.


ALT A map of Romania by municipality, colored for the winning candidate in the first round of voting in the presidential election. The map appears mainly orange, for far-right independent candidate Calin Georgescu, and magenta, for current Social Democrat Prime Minister Marcel Ciolacu. The three top candidates were Georgescu, center-right USR party leader Elena Lasconi (in blue) and Ciolacu, where the first two advanced to the runoff. Half of the municipalities close to the Ukrainian border were won by Georgescu, with 72% in Suceava county in the north and 53% in Tulcea county in the eastern coastal tip, as the highest of the five counties annotated.


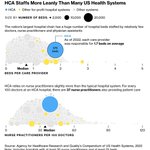
ALT Two sets of bar charts that each compare the revenue earned from (blue bar) and total compensation (yellow bar and difference shown as a dotted outline) of (1) primary care physicians and (2) nurse practitioners, physical assistants. For both, the blue bars are very close: $462K for (1) and $425K for (2). But the compensation is much higher for (1) at $344K vs. (2) at $157K. The profit margin for (1) was $118K, while it was $268K for (2).