

Data analysis, UX, & UI. We transform data for human consumption. contact@plotandscatter.com
Vancouver, BC
Joined October 2014
- Tweets386
- Following158
- Followers182
- Likes33




Pinned Tweet
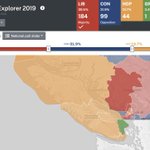
Our Canadian Election Explorer returns, newly updated for 2019: plotandscatter.com/canada-el… Would love to hear your feedback! #cdnpoli

ICYMI last week, our latest viz: How blue is Alberta? An interactive history of regionality in Canadian elections plotandscatter.com/canadian-… – at Downtown, Vancouver
Don’t know who wrote it, but it’s a nice overview — and the linked visualizations are worth checking out! – at Downtown, Vancouver

Pleasantly surprised that the Canadian government issued this short and sweet dataviz primer. Let’s see if we can find out who wrote it @robroc @chadskelton @nicolaskruchten @stefhaustein @plotandscatter @janezhgw
H/t @cjlmiles via @DataVizSociety
open.canada.ca/en/data-visua…
Plot + Scatter retweeted

This is interesting...

How blue is Alberta? Very! This election result is in no way historically special. Interactively explore regional party support in elections since 1968 with our new visualization: plotandscatter.com/canadian-… #cdnpoli #elxn43

How effective is a regionally-weighted swing model (of the kind used in our app at plotandscatter.com/canada-el…) at predicting election results? Here are the preliminary findings based on this week’s election. – at Downtown, Vancouver
On a regional basis, the model correctly predicted ridings as follows:
Atlantic 25/32 (78%)
Quebec 66/78 (85%)
Ontario 111/121 (92%)
Prairies 25/28 (89%)
Alberta 34/34 (100%)
British C. 38/42 (90%)
Territories 2/3 (67%) – at Downtown, Vancouver
How blue is Alberta? Very! This election result is in no way historically special. Interactively explore regional party support in elections since 1968 with our new visualization: plotandscatter.com/canadian-… #cdnpoli #elxn43 – at Downtown, Vancouver
For anyone who wants to work with the preliminary results from last night’s election released by @ElectionsCan_E, the long format can be a little annoying. I put them into wide CSV format: gist.github.com/hangler/0554… May have errors: caveat downloader. #cdnpoli #elxn43 – at Downtown, Vancouver

One interesting finding: a swing model (using regional weights from last night) suggests that the Liberal vote was so efficient that even had the Conservatives won 36.5% of the vote *exclusively at the expense of the Liberals*… – at Downtown, Vancouver
…(i.e. Liberals at 31.0%), they would only have had ~50% chance of winning a minority. Again, this is assuming a regionally-weighted swing, usual disclaimers apply, etc, etc. But still. – at Downtown, Vancouver
New version of the Canadian Election Explorer deployed, now with preliminary Elections Canada results from last night: plotandscatter.com/canada-el… #cdnpoli #elxn43 – at Downtown, Vancouver

For posterity: our simple regionally-weighted election app (plotandscatter.com/canada-el…), using CBC Poll Tracker regional values, gives L144 • C119 • N42 • BLQ 31 • G2. Only a few hours till we know for sure… – at Downtown, Vancouver

Lots of talk of minority governments lately! The Insights view, newly added to our tool (plotandscatter.com/canada-el…), simulates elections and shows statistically likely outcomes. A large variety of possible minority coalitions, given current polling numbers. #cdnpoli #elxn43 – at Downtown, Vancouver

At least with these figures, the number of available two-party coalitions is relatively low, reflecting just how fractured public opinion appears to be. CON + NDP seems statistically likely, but is perhaps politically less so. LIB + NDP only works ~56% of the time. – at Downtown, Vancouver
Plot + Scatter retweeted

Looking forward to it! The new version is live and available here: plotandscatter.com/canada-el… Still a few more features to come in the next day or two… – at Downtown, Vancouver
Plot + Scatter retweeted

At #ieeevis #VisInPractice next Monday (Oct 21),
@hangler of @plotandscatter will speak about redesigning a Canadian election visualization system (timely given that Oct 21 is Canada's federal election day)
visinpractice.github.io/prog…
