

Home of "Mr Breakouts". Algo Breakout Trading Specialists. Tips and strategies on algorithmic breakout trading. Disclaimer: https://xitter.cf/t.co/G4wi1ZckMa
Joined April 2018
- Tweets3.6K
- Following11
- Followers7.7K
- Likes1.1K


Pinned Tweet
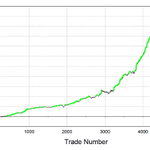
One condition. No indicator. No parameter to optimize. It filtered 80% of bad trades from a NASDAQ breakout strategy.
The condition: is the high of the entry bar above today's open?
That's it. One line of code.
If yes, the market has been trading above today's open. There's an established uptrend for the day. Enter the long breakout.
If no, the market is below today's open when your signal fires. You're not in an uptrend. You're trading noise. Skip.
Before:
- Net profit/drawdown ratio: 5.24
- Drawdown: ~$40,000
- Average trade: $120
After:
- Net profit/drawdown ratio: 7.97
- Drawdown: ~$25,000
- Average trade: $162
Net profit went up while drawdown got cut. That's the signature of a genuine filter. It's removing the right trades, not random ones.
Why does it work? Breakout trading is about momentum. If you're buying a breakout to the upside but the market has been trading below its open all day, there's a contradiction. The price level is breaking out, but the day's direction says otherwise. Those trades are the ones that chop you up.
No parameters means no overfitting. This is pure trading logic. You could test it on any long breakout strategy, on any market, in minutes.
The power isn't in complexity. It's in asking the right question.
What's the simplest filter you've ever used?

One simple formula built over 2,500 trading strategies in my hedge fund.
It works on every market I’ve tested.
Four parts. That’s the whole thing.
1. Point of Initiation - Where you calculate the breakout from. Usually a moving average on daily data, like MA(10).
2. Space - How far price needs to move before you enter. ATR multiplied by a fraction.
Example: Point of Initiation + ATR(20) × 2.2.
3. Time - When to enter. Not every hour or day is equal. Certain windows produce better breakouts than others.
4. Filters - When NOT to trade. ADX, trend direction, volatility context. The filters remove the noise.
No secret indicator stack. No neural network. No PhD.
What makes this formula work isn’t complexity. It’s universality.
Traders around the world have taken it and applied it to markets I never even considered. Hong Kong Hang Seng. Australian SPI. Singapore. Norwegian markets. Asia, Europe, and the US. Same four components.
Breakouts are a universal market behavior. Every market has moments of compression followed by expansion. The formula captures that expansion.
Four components. 2,500+ strategies. One formula that travels.

Bookmark this and watch the full video here:
youtu.be/QRDlzfevuxU
If you want the full framework behind these four parts, including how they were developed and applied across different markets, the complete breakdown is in the Breakout Trading Revolution book:
go.breakouttradingacademy.co…

Breakout Trading Academy retweeted
ATR is one of the few indicators that can do everything - entry, filter, and exit.
I use it in my hedge fund systems every week.
Example:
Entry
➝ Start with today’s open.
➝ Add 2.5 × ATR(20) to define your breakout level.
➝ That is the foundation of my breakout model.
Filter
➝ Compare two ATR periods to confirm momentum.
➝ If short-term ATR rises, the trend has real energy.
Exit
➝ Reverse the idea.
➝ Use ATR multiples to position stop losses that move with volatility.
One indicator.
Three functions.
A full trading strategy.
I posted the examples and TradeStation syntax in the comments.

Breakout Trading Academy retweeted
When I started trading, everyone told me to use Stochastics.
So I did.
For 25 years, I tried to make it work - discretionary trading, systematic trading, every variation possible.
It never worked.
I thought maybe I was doing something wrong.
Then I ran the data.
✓ 100 indicators
✓ 3,500 breakout strategies
✓ 15 years of data
The results were clear:
➝ Stochastics ranked among the worst performers.
➝ It made strategies worse, both in-sample and out-of-sample.
The mistake wasn’t using it.
The mistake was believing it had to work.
Watch the video below to see how I discovered the truth.
Breakout Trading Academy retweeted
When I started trading breakouts, I obsessed over ATR periods.
Should I use 14? 21? 50?
I thought the wrong choice would ruin my strategy.
So I tested it.
18 years of E-mini S&P breakout data, across multiple ATR periods.
The results surprised me.
ATR is robust.
Shifting the period doesn’t radically change results.
It’s not fragile like moving averages.
The best choices? 14–15, 25, and 40.
Even 10 or 60 are fine.
The lesson?
Stop chasing “perfect.”
Focus on building robustness.
Watch the video and get the free resource in the comments ↓

Breakout Trading Academy retweeted
I combined three different opening gap breakout strategies on E-mini NASDAQ into one portfolio.
One fades an aftermarket gap down (long).
One continues a gap during regular hours (long).
One fades a gap up on the short side.
Different sessions. Different directions. Different setups.
Initial result looked solid, but the drawdown was still too high for my taste.
So I ran day-of-week analysis on each strategy and kept only the stronger days:
First strategy: Wednesday and Friday only
Second strategy: Tuesday and Wednesday only
Third strategy: Thursday only
Then I reconnected them.
The portfolio got smoother. Drawdown dropped. Correlations stayed extremely low.
Final displayed result on the combined portfolio:
Total P/L: $286,820
Trades: 524
Win rate: 59.9%
Max drawdown: $21,895
Profit factor: 2.49
Net profit / drawdown: 13.04
You can build a full portfolio using only opening gap breakout strategies.
Different sessions and directions do the diversification work for you.
Save this and watch the full breakdown (including the three original strategies): youtu.be/U8DEUtmWwes
A new chapter of trading discussions is coming!
I'm diving into prop firm evaluations, strategy selection, drawdown management, and funding readiness.
If prop firm trading interests you, stay tuned!
But first, where are you in your funding journey?
0%Already funded
45%Taking an evaluation
36%Planning to get funded
18%Not interested yet
11 votes • Final results Breakout Trading Academy retweeted
I used to believe a higher win rate meant a better system.
Every time I saw 85% or 90%, I felt confident.
But, this used to be completely wrong thinking.
And in this test I want to share with you why:
➝ I analyzed 2,500 breakout strategies
➝ Compared in sample win % with OOS performance
➝ The correlation was only 11%
That means the win rate has almost no predictive value.
The more I used to push it higher, the worse my systems performed live.
I also tested net profit instead.
✓ Correlation jumped to 63%
✓ Systems became more stable
✓ Results finally held up in OOS pretty well
That single test can changed the outcome of your every strategy.
Watch the video below - I’ll show you the exact data behind it. ↓
Breakout Trading Academy retweeted
This AI trading idea made me look like a fool.
I’ve been calibrating the ADX indicator for over 20 years. Thousands of parameter combinations across every major index market. So when I asked AI to improve my ADX filter on an E-mini NASDAQ strategy, I expected something marginal.
It proposed replacing part of my logic entirely.
Original strategy: $87K net profit, $23K drawdown.
After AI’s filter: $200K+ net profit, $13K drawdown.
Drawdown cut nearly in half. Profit more than doubled.
The strangest part? The AI’s suggestion was simpler than what I had. Not more complex. Simpler. It took one piece of the ADX logic and replaced it with a cleaner, more direct measurement of what ADX was trying to capture in the first place.
This doesn’t mean AI replaces experience. I still had to evaluate whether the improvement was genuine or just overfitting. I still ran it across multiple markets and out-of-sample data.
But AI spotted a pattern in indicator behavior that 25 years of screen time missed. When that happens, you’d be foolish to ignore it.
AI simplified what I spent 20 years making complex. That part is still sitting with me.
Bookmark this one. The full AI ADX improvement step by step:
breakouttradingacademy.com/t…
Most traders quit ADX too early.
My ADX Playbook has the 13 plays my hedge fund actually uses it for. Exact settings, real strategy examples, and ready-to-run code for any platform.
Grab it here:
go-bta.com/adx-playbook-x

Breakout Trading Academy retweeted
What’s the edge smart traders build?
Nikkei opens while most of the West sleeps and it’s handing out $100+ breakout trades with ease.
✅ Easy to access via CME
✅ Works great with my breakout formula
✅ Loves the same ADX settings I use for US indexes
Most algo traders are glued to Nasdaq.
You don’t have to be.
See the result below and watch how I built a Nikkei strategy from scratch in the comments. ⬇️

Breakout Trading Academy retweeted
An $88,360 profit in a selected backtest looks impressive.
But there's a catch most traders would miss.
I was trying to solve a difficult problem: building short strategies on E-mini NASDAQ.
Indexes tend to rise over time, making reliable short-side opportunities harder to find.
Yet short strategies can be valuable when your long strategies struggle during market declines.
So I tested opening gaps.
Not just one setup.
I generated 225 short-gap prototypes using:
→ 3 gap definitions: Pre-market, regular session, aftermarket
→ 3 ATR periods: 5, 20, 40
→ 25 ATR multipliers to calculate breakout entry levels
Then I ranked the candidates using in-sample data and checked their performance out-of-sample.
Most initial results were disappointing.
Many setups looked attractive in-sample but struggled when tested on unseen data.
Short gap continuation didn't produce a viable candidate in this experiment either.
But one aftermarket gap-fading candidate was worth investigating further.
After examining day-of-week performance, the Thursday-only version produced these backtest results:
• 114 trades
• +$88,360 total P/L
• 57.9% win rate
• $775 average trade
• -$9,615 maximum drawdown
Impressive?
Potentially.
But 114 trades is still a relatively small sample. Overfitting remains a possibility, and cross-validation on other indexes is still needed.
Here's the lesson:
Finding a promising equity curve is only the beginning.
The real work is finding out whether the strategy deserves your trust.
Want to explore opening-gap strategies yourself? Check out our Gap Breakout Playbook here → go-bta.com/gap-breakout-play…
