

Market & Portfolio Strategist | Macro, Market Structure & Digital Assets - Founder of 62ndAlpha - Sign up https://xitter.cf/t.co/Wl4EgCdEzg
Joined November 2021
- Tweets34K
- Following135
- Followers5.2K
- Likes32.2K


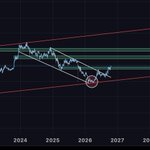
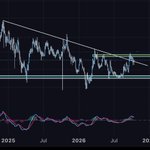





$AVAX currently retesting the BMSB and coming out of a bear market accumulation phase.
Weekly RSI broken. If the charts gains acceptance above these key levels, the move to $40 will be smooth.
BUY accruement layers.


$AVAX steady in accumulation.
Next time we break the BMSB we pump hard. Avalanche will rise from the dead.☠️


I’m live streaming the Friday mentorship program today.
Going to cover trade setups.
Entries.
Exits.
Risk management.
People pay a lot of money for this group every Friday - come see what the fuss is all about.
Starts in 30 min.
1pm mountain standard time.
Link - youtube.com/@62ndalpha?si=t8…

We aggressively accumulated the lows on $INJ.
Here I circled this post from 4/11/26 for you.
HIGHER.


Price is above 50wSMA.
Price above HTF support.
Metrics have bottomed.
Supertrend flipped green.
Just keep it simple.
$BTC

$BTC might put In a wider correction.
Hold 80k, we go higher.
Lose it, 74-75k is likely.
The market regime is in buy the dip mode.
When do we stop buying the dip?
Never, not at this point.


$SUI is approaching a major structural test. 👀🔥
The setup: hold ~$0.85–$0.90 support, break the descending trendline, then reclaim $1.30–$1.40.
That reclaim could turn this recovery into a larger reversal, opening the path toward $2, $3, and eventually $4.
Lose support and the bullish roadmap weakens. Until resistance flips into support, this is a setup, not a confirmed breakout. 🕯️
Bigger picture: a rejection does happen, strong bottoming formation with a MASSIVE iH&S.

$RENDER looks like it could be next in line for a major move. 👀🔥
This chart has spent almost TWO YEARS grinding through lower highs, lower lows, and a relentless descending channel.
Now price is pushing above the upper boundary of that channel and challenging the SECOND resistance line marked in red.
That’s why this area matters. Breaking one trendline is encouraging. Clearing both would strengthen the case that the broader downtrend is finally losing control. 📈
The move off the recent lows has brought RENDER straight into the ~$2.10–$2.25 decision zone.
What I want to see next:
✅ A decisive weekly close above that resistance
✅ A retest that holds as support
✅ Follow through that breaks the previous swing high
If that happens, my upside roadmap is:
🎯 ~$2.70–$3.00 > first resistance zone
🎯 ~$4.00–$4.50 > previous trading area
🎯 ~$6.00 > bigger historical resistance
These are checkpoints, not guaranteed destinations.
A rejection here could still send price back toward ~$1.50–$1.70, so the weekly close matters more than a wick through resistance.
The reason I’m watching closely: it’s attempting to break the structure that has capped every recovery for nearly two years.
Clear it. Hold it. Then we could see a very different chart. 🕯️🚀
On a different LEVEL 👇🏾👇🏾👇🏾👇🏾
The fundamentals make this setup even more interesting. 👀🔥
Render connects GPU owners with users who need computing power for 3D rendering, and its compute infrastructure supports AI workflows including inference, training, and generative imaging. That gives it exposure to the infrastructure behind the AI narrative.
There’s also a link between usage and the token: paid work drives RENDER burns through its burn and mint model. More demand can mean more burns, although emissions still matter when assessing the net supply impact.
And this is why I’m watching it alongside $NEAR
⚡ RENDER — GPU compute for rendering and AI workloads.
⚡ NEAR — infrastructure that helps AI agents move assets and execute transactions across blockchains.
My thesis: if the AI trade starts gaining momentum again, attention could spread across BOTH compute infrastructure and the emerging agent economy.
NEAR getting attention could bring investors back to the wider crypto AI sector and RENDER has a clear story within that rotation.
Combine that potential narrative with the breakout attempt on this chart, and you have a setup worth watching closely.
The catalyst is attention. The staying power has to come from adoption. 📈🔥

7OH is poison and I can’t believe the United States of America has not made it a schedule 1 substance.
I’m all for liberty and freedom to make your choices, but selling a potent opiate over the counter for anyone to buy is fucking stupid.
I’m a firm supporter of botanicals. But concentrated synthetic opiates 30x more powerful than morphine that can be bought at local smoke shop just pushes the opiate crisis forward in immeasurable ways.
This shit is fucking personal.
😂🎯👀🤷🏽♂️
In a bull market - we tend to take downside liquidity, smash open interest, and continue on.
Best trading environment.

$BTC since the bottom.
Support / prior swing low → wick or trade below it → failure to hold below → reclaim → expansion higher.
Learn how to trade this sequence and you’ll make money.

The 2-week TOTAL crypto market cap chart excluding stablecoins is sitting at a MASSIVE decision point. 👀🔥
This is the kind of chart I watch to understand the bigger picture across crypto.
Excluding stablecoins removes changes in dollar-pegged token supply from the total, giving us a clearer view of how the market is valuing crypto’s risk assets. 📊
And on the 2-week timeframe, every candle represents 14 days. These levels reflect YEARS of market structure.
Look at the confluence:
🔸 A rising macro trendline extending from the 2018 bear-market lows.
🔸 The 0.618 Fibonacci level around 1.98T.
🔸 The former 2021 cycle-high zone around the current $2.52T area.
🔸 The orange moving average converging near that overhead resistance.
We’ve bounced from the lower support cluster and are now testing whether the market can reclaim that historical ceiling.
That’s a BIG deal.
A decisive 2-week close above this zone, followed by a successful retest, would strengthen the case for another major expansion. Rejection keeps this a resistance test; losing the ~$1.98T support and rising trendline would weaken the bullish structure.
The longer-term upside reference on this chart? The 1.618 extension near 12.7T. 🚀
That’s a conditional macro target, not a promise or a timeline. The turquoise path illustrates a possible scenario, not future price data.
For now, the question is simple: can crypto turn this former cycle ceiling into a durable floor?
Because that’s where the next major leg could start. 🕯️🔥


Follow this man.
I spend 5-15 min a day looking through CT; MOST profiles on here are complete projectile vomit bullshit.
@Cryptollica is one of the few I like and respect.


$SEI UPDATE: The first test of resistance brought a pullback. Now comes the part that matters. 👀🔥
In my last post, SEI was attacking the ~$0.08 resistance zone after exploding off the lows.
Since then, price has slipped from ~$0.0742 to ~$0.0689.
The resistance zone held on that attempt. But look WHERE price is pulling back:
Right toward the lower boundary of the massive descending channel it previously fell beneath. 🕯️
That gives us a potential reclaim and retest setup.
If buyers defend that diagonal and establish a higher low, SEI could build the foundation for another attack on ~$0.08.
Reclaiming that horizontal zone would clear the first hurdle. The green moving average is also overhead, while the upper boundary of the multi-year channel remains the bigger structural test.
These are separate hurdles. Clearing the lower diagonal does NOT mean the entire macro downtrend has broken.
My roadmap, if those confirmations arrive:
🎯 ~$0.08 → horizontal reclaim
🎯 ~$0.10–$0.12 → upper channel breakout area, depending on timing
🎯 ~$0.20 → historical resistance
🎯 ~$0.35–$0.40 → next major supply
🎯 ~$0.70–$1.00 → major historical supply zone
The weekly RSI breakout highlighted in my previous post was an early momentum signal. Now price needs to follow through.
Lose the reclaimed diagonal and fail to build a higher low? A revisit toward the recent lows comes back into play.
Hold it, reclaim ~$0.08, then break the upper macro trendline?
THAT is when this chart starts telling a much bigger story. 🌊🔥
The turquoise path is the bullish scenario I’m watching. Every step still has to be earned.
$SEI is at the retest stage. Now let’s see whether buyers can turn the rebound into a structural reversal.

$SEI might be sitting at one of the most important levels in its entire price history.👀🕯️🔥
This chart has been trapped in a massive descending structure since 2024.
Lower highs.
Lower lows.
Repeated rejection from the same macro trend.
But now something is changing.
Price has exploded off the lows and is attacking the $0.08 resistance zone at the exact same time it is challenging the multi-year downtrend.
Even more interesting: weekly RSI has already broken its own long term descending trendline.
Momentum may be leading price.
If $SEI can decisively reclaim this resistance and break the macro structure, I think the chart enters an entirely different regime.
My roadmap from there:
🎯 ~$0.10–$0.12 > macro breakout/retest zone
🎯 ~$0.20 > first major historical resistance
🎯 ~$0.35–$0.40 > previous structural resistance
🎯 ~$0.70–$1.00 > major 2024 supply zone
🎯 Price discovery above the old highs
And if SEI enters true price discovery during a full-blown altcoin expansion?
That’s where the upside can get stupid.
The fundamentals make this MUCH more interesting.
Sei isn’t standing still technologically. The network is transitioning toward a streamlined EVM only architecture, while the Giga roadmap is rebuilding consensus, execution and storage around extreme performance. Sei’s stated target for Giga is 200,000 TPS, and the first phase of its new Eidos storage architecture already reached mainnet in August. (Sei Blog) ✍🏻
This also isn’t an empty chain waiting for users. ⛓️💥
Sei previously reported 1M+ daily active users, 60M total wallets, 200+ mainnet projects and a peak of $687M in TVL. By February 2026, it reported more than 5 BILLION transactions, 90M+ wallets and over $3B in stablecoin volume in just 30 days. (Sei Blog)
Native USDC/CCTP infrastructure has strengthened the liquidity story, while Sei’s broader thesis is increasingly centered around becoming a high-performance settlement and trading layer capable of combining EVM compatibility with extremely high throughput. (Sei Blog)
So look at the setup:
Multi year downtrend.
Major horizontal resistance.
Weekly RSI breakout.
Price attempting the macro breakout.
EVM focused architecture.
Giga upgrades reaching mainnet.
Real users + stablecoin activity.
That is exactly the type of combination I want to find BEFORE the chart looks obvious.
$0.07 SEI isn’t interesting because I’m assuming it goes to $2.
It’s interesting because if this multi-year structure finally breaks, the entire technical regime changes.
And if fundamentals + liquidity + an altseason all collide at the same time…
$SEI could get absolutely violent. 🌊🔥


🚨SOLANA AND SUI JUST LANDED IN SAMSUNG WALLET!
Samsung said U.S. Galaxy users can send USDC from Samsung Wallet starting the last week of October, across 82 million devices.
It sits in the same wallet as cards and IDs, not a separate crypto app.
Coinbase and Bastion operate the USDC, Bastion is the licensed custodian.
Solana and Sui are the blockchain rails behind it.
👀👀$USDT.D is sitting at a HUGE pivot👀👀
This chart explains why I’m watching it alongside Bitcoin. 👀🔥
USDT dominance measures Tether’s share of the total crypto market. When BTC and alts rise faster than USDT’s market cap, that share falls. When crypto sells off, it often rises. That’s why these charts frequently move in opposite directions.
On this chart, dominance has rejected the upper resistance around 9% and returned to the critical 6.3–6.7% zone. Momentum is rolling over too, with a bearish crossover and negative histogram reinforcing the weakness.
Lose this support, then fail to reclaim it, and the next major level I’m watching is 4.36%, followed by the lower support around 3.7–4.0%.
That would be a VERY bullish backdrop for crypto if BTC and alts are expanding while stablecoin dominance contracts. 🚀
But support hasn’t decisively broken yet. A bounce and reclaim would delay that setup.
The turquoise path is the scenario I’m watching, not a guaranteed forecast. Falling dominance alone doesn’t prove money is leaving USDT; it can also reflect rising crypto valuations.
Watch the breakdown. Watch the retest. Let price confirm. 🔥

$USDT dominance is on the verge of major capitulation.
Lose the BMSB - and the MACd & RSI confirm the breakdown.
