

intermarket / cycles / trends all opinions are my own, not investment advice, etc.
Joined November 2023
- Tweets1.3K
- Following355
- Followers8.3K
- Likes4.6K





Ricardo Sarraf retweeted

How much of the euro's swing do the rates explain?
EUR/USD (black) and Bund-Treasury spread (blue) fell together since summer (60-day correlation: 0.84). But the relationship broke down in 2025 and 2026: it accompanies, it does not guarantee.


Ricardo Sarraf retweeted

If only someone had warned you...
Oh wait, I DID!


Ricardo Sarraf retweeted

2026 will be remembered as the year of the 60-40 Portfolio.
60% Tech with 40% Energy.
Oil & Gas Explorers breaking out to all-time highs.
$IEO


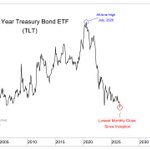
The 20+ Year Treasury Bond $TLT finished today's session at its lowest monthly close since inception.
This ETF product goes back to July of 2002...


The biggest development today wasn't Leopold and his Situational Awareness liquidation.
It was the US Dollar Index $DXY putting in a failed breakout at a key level. It's now back in its one-year range, giving dollar bears an opportunity to press a meaningful advantage.
Ex-US capital markets writ large should benefit from a falling dollar.
Here's the developed markets side of the equation: $EFA put in a nice green stick today as it presses toward fresh all-time highs.
As long as dollar weakness persists, ex-US stocks can retake the leadership baton into the back half of 2026.

Latin American currencies are getting closer to completing a classic Wyckoff-style accumulation pattern vs the US Dollar.
Today, the $DXY is moving squarely back into it's range.

So, the US Dollar Index $DXY is threatening to break out of a year-long range?
But Latin American Currencies are looking to complete a classic Wyckoff-style accumulation pattern vs the US Dollar?
One of these will be wrong.

Money has been rotating out of the semiconductor and AI infra themes, aggressively.
In that environment, these are dangerous patterns to see resolve higher if you're bullish the broader market.
Staples look dangerous vs discretionary across the market cap ladder.
Whether these patterns fail lower or resolve higher will be an indication of how defensive that rotation gets.
$XLP / $XLY $PSCC / $PSCD


Revisiting the $SPX / $VIX ratio, things still look shaky in the near term for the bulls.
The ratio keeps stalling at the same level that has capped it repeatedly this cycle.
Most prior tags lined up with a correction or a pullback in the S&P.
Implied vol won't stay down long enough for the ratio to break out.


Always an honor to have work featured on The Chart Report. Thank you
Shoutout to the editor @TheDonInvesting

Today's Chart of the Day was shared by @nullcharts
Continued deterioration in these ratios would mark a major shift away from the leadership that’s defined this bull cycle.
Get the full breakdown in today's report plus more great charts. ⬇️
thechartreport.com/07-24-26

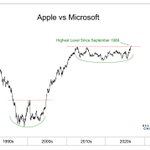
Apple just hit its highest level vs Microsoft since September 1989.
Pretty cool... Never forget that Bill Gates is is a pedo.
$AAPL $MSFT

$AAPL, the forgotten giant...
It's no longer exciting, but remains a portfolio staple... and still the second largest stock on the planet.
Right now, it's quietly printing 52-week highs vs the Nasdaq composite following a multi-year downtrend breakout.

Two of my favorite offense / defense ratios are threatening to roll over in a meaningful way.
Growth vs Value ( $IWF / $IWD ) is sliding back toward the prior cycle highs, a level that has held as support for over two years. A break below here threatens to change the character of this market.
Mag Seven vs Energy ( $MAGS / $XLE ) is already rolling over.
The choppy market we've seen this year is consistent with midterm election year seasonality patterns.
But if these ratios follow through lower, that's more than seasonality.

👀

REITs and Bonds have typically traded together.
Due to interest rate sensitivity or more typical recurring cash flows perhaps.
The reason isn't really important to me but the correlation between them is.
And recently they have not been correlated, it's been the opposite.
You can't see it well on this line chart but $XLRE just attempted to break out of this base and after only one day retreated back below the breakout level.
If REITs can't break out of this base that could be suggesting the market is hawkish.
If that is what's happening I would expect $TLT to resolve lower and for the two asset classes to once again be correlated.


The action in Singapore $EWS over the past three weeks bodes well for the emerging and frontier market trade.
Many index providers consider Singapore developed, but it trades closer to traditional emerging markets like Latin America.
Notice how $EWS broke out above a near multi-decade downtrend line in early 2025, around 4 months ahead of a similar breakout in Latin America $ILF.
Now it's pressing against all-time highs while $ILF still struggles in the short to mid-term.
By no means pressing the gas here, but it's constructive going into the back half of 2026.

$AAPL, the forgotten giant...
It's no longer exciting, but remains a portfolio staple... and still the second largest stock on the planet.
Right now, it's quietly printing 52-week highs vs the Nasdaq composite following a multi-year downtrend breakout.
What if this massive consolidation in $META does not turn into a distribution event?
Gap above the ATH VWAP and the 200D SMA holding for now.

European financials $EUFN have been leaders this cycle for the first time in many decades.
Looking elsewhere in the developed world, it’s a similar story. Japanese banks are on fire.
But under the surface, emerging-market banks have lain dormant since late January.
Here’s Egypt’s largest publicly traded bank, Commercial International Bank $CIBEY working on clearing a key polarity level.
Broadly, EM financials are setting up for a ripper in the back half of 2026.
