
Mostly #rstats, usually data, often viz, frequently Florida, regularly spatial.
Tampa, FL
Joined January 2017
- Tweets54
- Following124
- Followers23
- Likes208



This stackoverflow q&a covers the case.
stackoverflow.com/a/65741652…
tl;dr: R recycles vectors.
1
2
Looks like the last bit got cut off, here's the link:
youtube.com/playlist?list=PL…
1
4
Matt Hellmann retweeted

.@GovRonDeSantis says that someone with a geography degree is "not a data scientist." It's critical to recognize the role geographers & GIScientists play during COVID-19. If you agree sign AAG's letter to the Governor reminding him that geography matters https://xitter.cf/t.co/GYVs1LWiNE
If you don't like the colors, the definitely don't look at the scale. Who needs continuous when arbitrary breaks are good enough?

2
Nice work. Six of the seven most populous counties in the lead, no surprise.
Slopes may a better indicator, but I'm no epidemiologist. Know any?
Alachua, yellow at the bend, is testing at ~2x the rate of other counties. Walton in the panhandle has a few cases in a small population. Greater Miami just has a huge population.
Are the coronavirus maps you're seeing just maps of where people live, or where testing is happening?
Here's the latest FL data interpreted four ways:


I'll bet you're right. Maybe the gov should
"Just focus on gathering and sharing high-quality data in a CSV file w/ a download link[!]"
I may have stolen that idea from somewhere...
That terrible FL dashboard changes formats every time I check it. Best I've found for .csv: have to click the 'get the data' on the poorly done map: tampabay.com/news/health/202…
1
Nice article. A map to go with it: xitter.cf/mrhellmann_/status/121…


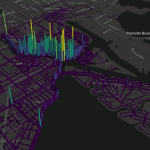
Hex grid of pedestrian accidents 2012-2019. Data from FDOT. Hillsborough Ave, MLK, US 41, Kennedy, Nebraska, and ~30 other roads with more accidents.
2
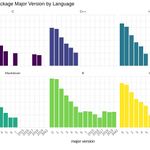
R package major versions by language.
Start at 0? Start with the year? Or somehow end up with 3042 like rmetrics?
#TidyTuesday

1