

Physics and macro-based market forecasts for QQQ and BTC • Transparency archive + JSON in pinned post • Not financial advice
- Tweets584
- Following62
- Followers198
- Likes1.2K
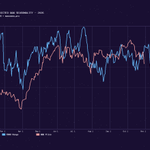

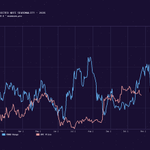

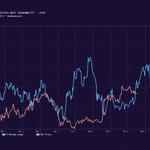
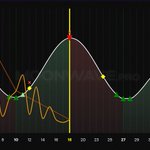




ALT Moonwave predicted market sentiment chart for Nov 1, 2026. The chart shows physics-predicted times of increasing or decreasing demand for risk assets, with high-probability buy/sell/volatility points. The price of BTC is represented by an orange line, and the price trend between wave tops and bottoms is represented by a dark orange line.


ALT Moonwave predicted market sentiment chart for Nov 1, 2026. The chart shows physics-predicted times of increasing or decreasing demand for risk assets, with high-probability buy/sell/volatility points. The price of BTC is represented by an orange line, and the price trend between wave tops and bottoms is represented by a dark orange line.

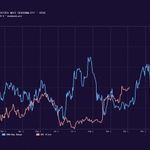
ALT Sunwave QQQ predicted seasonal momentum chart for Nov 1, 2026. The chart shows predicted price as a percentage of the 90-day trading range in blue, and the daily close price of QQQ in red.

ALT Sunwave BTC predicted seasonal momentum chart for Nov 1, 2026. The chart shows predicted price as a percentage of the 90-day trading range in blue, and the daily close price of BTC in red.

ALT Moonwave Predicted Market Sentiment chart for Oct 25, 2026. The chart represents physics predicted high-low demand periods with high-probability buy/sell/exit points. The daily close price of BTC is represented as an orange line, with wave peak-trough performance as a dark orange line.

ALT Sunwave BTC predicted seasonal momentum chart for Oct 25, 2026. The model attempts to predict seasonal pivots in BTC price. The predicted price of BTC, as a percentage of 90-day trading range, is represented by a blue line. The actual daily close of BTC is represented by a red line.

ALT Moonwave Predicted Market Sentiment chart for Oct 18, 2026. The chart shows econophysics-predicted zones of rising and falling demand, and high-probability buy/sell/derisk points. The price of BTC is displayed as an orange line, and the price trend between wave tops and bottoms is displayed as a dark orange line.

ALT Sunwave predicted BTC seasonal momentum chart for October 18, 2026. The chart is the output of an experimental model meant to forecast seasonal pivots in BTC momentum. The predicted price as a percentage of its 90-day trading range is displayed as a blue line, and the daily close of BTC is represented as a red line.

ALT Moonwave 8-week predicted market sentiment chart for Oct 11, 2026. The chart represents physics-predicted areas of increasing/declining demand, and high-probability buy/sell/derisk points. The close price of BTC is represented as an orange line.

ALT Sunwave BTC seasonal momentum forecast chart for Oct 11, 2026. The chart represents the predicted price of BTC, as a percentage of its 90-day trading range, as a blue line. The daily close price is represented as a red line. The chart is the output of an experimental method of forecasting seasonal pivots in price momentum.

ALT Moonwave 8-week Predicted Market Sentiment chart for Oct 4, 2026. The chart graphs physics-predicted times of bullish/bearish bias with high-probability buy/sell/derisk points. The price of BTC is represented as an orange line.

ALT Sunwave BTC seasonal momentum chart for October 4, 2026. This experimental indicator attempts to identify seasonal pivots in BTC momentum, with predicted price as a percentage of 90-day trading range in blue, and the actual daily close of BTC in red.

ALT Moonwave 8-week Predicted Market Sentiment chart for Sep 27, 2026. The chart graphs physics-predicted areas of bullish/bearish bias and high-probability buy/sell/derisk points. The price of BTC is represented as an orange line.

ALT Sunwave 2026 seasonal momentum prediction chart for BTC, September 27, 2026. The chart graphs the predicted price of BTC as a percentage of the 90-day trading range in blue, and the daily close price of BTC in red. The model tests an experimental method of predicting seasonal pivots in asset prices.