








$NPC
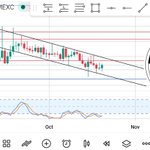
It's a matter of time npc will break this channel with bull candle 🚀🚀
Consolidation before a big upside move, giving us a chance to buy 👀👀
Just patience 🙋🙋
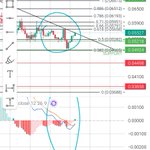
0.1$ just a start of bull run for npc.


$DOT
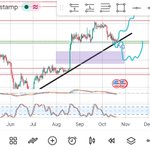
DOT found its resistance zone between 1.26$ and 1.30$, which it has tested multiple times but faced selling pressure each time, it has already found support at the rising trendline and demand zone. Once it breaks above 1.30$, the upper levels will open up for DOT, targeting 1.39$ and potentially 1.66$.🚀🚀
Patience 🙋
#dot #gamedev

$DOT
Multi-timeframe charts show DOT still well below its prior cycle peak near $55, with the longer-term Supertrend remaining elevated. On shorter timeframes, price is holding above major moving averages after rebounding from recent lows near $0.63–$0.80, with current consolidation centered around the $1.20–$1.30 range.
Key levels to monitor remain near-term support around $1.20 and resistance near $1.30. Indicators reflect mixed signals across timeframes, with shorter-term structure appearing more constructive than the broader multi-year trend.
On weekly trend shifted, now uptrend begin's as show.
On daily golden cross and we'll above the MAs but find resistance on 300, when it break you know what will happen.
On monthly it's still in drawdown, close above 4$ will open the gate for dot for much higher targets. @Polkadot
#dot #crypto


$ETH
Eth still in decision making state no change at all.
Rsi over sold region 👀
Bull still in control 🙋
They make you bearish first and then fly to the moon
Your decision 🙋

$ETH
ETH Update – Decision time
Ethereum remains in a broader uptrend on the higher timeframes, but it is now at a critical decision point.
Support zone:
Price is testing a strong confluence area between $2,350 and $2,380, which aligns with a rising trendline support. This zone has held so far and continues to act as a key demand area. As long as ETH stays above this region, the bullish structure stays intact.
Bullish scenario:
If ETH holds the $2,350–$2,380 zone and produces a clear bounce, upside targets remain open. A strong reaction from this support would keep the recovery structure valid and open the door for a move toward the next resistance levels.🚀🚀
Bearish scenario
A clean breakdown below the trendline and the $2,350–$2,380 support would shift the short-term bias. In that case, price could target the fair value gap (FVG) below, increasing the risk of a deeper pullback. 👀👀
Let see tik tok 👀🚀


$others/btc
Others chart look bullish 🙋
Bull flag in play 👀👀 once it start move your coin would fly 🚀🚀
Rsi over sold and consolidating 🙋
218B $ solid support for now some pullback towards 206B$ expected otherwise it can move from here as well.
Patience 🙋🚀


$NPC
Npc update remain same 🙋
Patience 👀🚀
Sit back relax enjoy the show 🙋🙋

$NPC
Descending Channel + Elliott Wave
Price is currently moving inside a descending channel.
If it breaks the channel to the downside, the next support lies at 0.01615. DAC time 🙋
However, if price holds and starts moving higher, reclaiming the 0.02 level would confirm an upside breakout of the channel and likely mark the start of the next leg up. 0.1$ 👀
From an Elliott Wave perspective, the current structure looks like a Wave 2 correction. Wave 3 is typically the strongest and longest wave, and it is usually larger than Wave 1.
A successful reclaim of 0.02 and a break above the channel would support the idea that Wave 3 is beginning. Wave-3 0.1$ on-board
Patience all we need 🚀🚀


$ETH
ETH Update – Decision time
Ethereum remains in a broader uptrend on the higher timeframes, but it is now at a critical decision point.
Support zone:
Price is testing a strong confluence area between $2,350 and $2,380, which aligns with a rising trendline support. This zone has held so far and continues to act as a key demand area. As long as ETH stays above this region, the bullish structure stays intact.
Bullish scenario:
If ETH holds the $2,350–$2,380 zone and produces a clear bounce, upside targets remain open. A strong reaction from this support would keep the recovery structure valid and open the door for a move toward the next resistance levels.🚀🚀
Bearish scenario
A clean breakdown below the trendline and the $2,350–$2,380 support would shift the short-term bias. In that case, price could target the fair value gap (FVG) below, increasing the risk of a deeper pullback. 👀👀
Let see tik tok 👀🚀

$ETH
Quick update 👀👀
Patience 🙋

$ETH
ETH Update – Decision time
Ethereum remains in a broader uptrend on the higher timeframes, but it is now at a critical decision point.
Support zone:
Price is testing a strong confluence area between $2,350 and $2,380, which aligns with a rising trendline support. This zone has held so far and continues to act as a key demand area. As long as ETH stays above this region, the bullish structure stays intact.
Bullish scenario:
If ETH holds the $2,350–$2,380 zone and produces a clear bounce, upside targets remain open. A strong reaction from this support would keep the recovery structure valid and open the door for a move toward the next resistance levels.🚀🚀
Bearish scenario
A clean breakdown below the trendline and the $2,350–$2,380 support would shift the short-term bias. In that case, price could target the fair value gap (FVG) below, increasing the risk of a deeper pullback. 👀👀
Let see tik tok 👀🚀

$NPC
Descending Channel + Elliott Wave
Price is currently moving inside a descending channel.
If it breaks the channel to the downside, the next support lies at 0.01615. DAC time 🙋
However, if price holds and starts moving higher, reclaiming the 0.02 level would confirm an upside breakout of the channel and likely mark the start of the next leg up. 0.1$ 👀
From an Elliott Wave perspective, the current structure looks like a Wave 2 correction. Wave 3 is typically the strongest and longest wave, and it is usually larger than Wave 1.
A successful reclaim of 0.02 and a break above the channel would support the idea that Wave 3 is beginning. Wave-3 0.1$ on-board
Patience all we need 🚀🚀
$S
Keep on eye on sonic 👀
Patience 🚀🚀


$S update
Soon 0.1$ 🚀🚀
Sonic is clearly trading in a strong uptrend. After a sharp impulsive move higher, the price found solid support, entered a period of consolidation, and then launched into another strong upward blast.
The current structure appears to be a descending triangle. Given the prevailing uptrend and the way price has been respecting higher-timeframe support, this consolidation is likely building energy for the next leg higher. A breakout from this pattern looks increasingly likely in the near term, and it may only be a matter of time before the next impulsive move unfolds.
Patience 🚀🚀🚀
Fast , accurate and beyond sonic 🙋


$fet
Long term view on fet for those don't understand the power of patience.
FET remains in a higher-timeframe correction after the 2024 blow-off top.
Oversold Stoch RSI offers bounce potential, but structure is bullish, as HH and HL forming still didn't have structure break in higher timeframe.
According to this structure the next impulsive move target would be around 5 to 7$. Although time will tell the real one.
0.19 is the immediate decision level. A sustained break above 0.27 is required to shift the monthly bias.
Patience 🙋 your time will come trust the process 🚀🚀


$FET
FET has found strong support at the S.T indicator, which is a positive signal, and has also held above the 10-period Moving Average (MA10) on the weekly timeframe.
This confluence of support levels suggests that the prevailing bullish structure remains intact for now.
So it's a DCA time. Testing our patience.
Patience 🙋 upward momentum is about come soon 🚀


$NPC
$npc update soon 0.1$ 🚀🚀
On weekly timeframe npc touches 10 moving average and pullback strongly. Flushed all the short positions, weak hands and shop lose below the channel. It's a matter of time soon npc break 0.0216 like blast and never look back or it will break it and retest once and good to go upside. Both scenario can playout. 🙋🙋🚀🚀
Sit back, relax and watch where it will go in coming weeks🚀🚀👀👀
Patience 🚀🚀


$NPC
Npc what you want to touch 👀
Detailed TA done in previous post.
It's just a matter of time 🙋
Patience 🚀🚀

$S update
Soon 0.1$ 🚀🚀
Sonic is clearly trading in a strong uptrend. After a sharp impulsive move higher, the price found solid support, entered a period of consolidation, and then launched into another strong upward blast.
The current structure appears to be a descending triangle. Given the prevailing uptrend and the way price has been respecting higher-timeframe support, this consolidation is likely building energy for the next leg higher. A breakout from this pattern looks increasingly likely in the near term, and it may only be a matter of time before the next impulsive move unfolds.
Patience 🚀🚀🚀
Fast , accurate and beyond sonic 🙋