

Modo is an end-to-end multichain enterprise-grade data platform. The intelligence layer of Canton, and Sui. Discord: https://xitter.cf/t.co/NcRVTisyO4
Joined February 2021
- Tweets175
- Following853
- Followers7.8K
- Likes5.7K





Pinned Tweet
Modo is live.
Welcome to the intelligence layer of Canton.
Real data. Clear insight. No noise.
Built for validators, app teams, developers, and institutional capital.
If you’re building, investing, or researching on @CantonNetwork, this is where you start.

Markets move fast. Data gives you context.
$BTC is back above $80K. $ETH is moving higher. Sentiment is heating up.
Before you trade the narrative, look at what's actually happening on-chain.
Who is active? Where is activity concentrated? Which projects are driving it?
Check the data. Then make your call.
Explore @CantonNetwork through Modo 👇
modo.link/

What's more useful?
Knowing how much activity a network has
or knowing who is driving it?
Right answers only 👇
Understanding @CantonNetwork
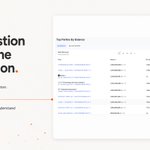
What is a participant?
Transactions tell you what happened.
Participants help you understand who is involved.
On Canton, participants can include applications, infrastructure providers, institutions and other ecosystem entities.
Seeing who is active, and how they're connected, adds context to the network.
That's what Modo helps you see.

You see a transaction on @CantonNetwork.
So you ask:
Who was involved?
Then:
What application were they using?
What project does it belong to?
What other participants are connected to it?
Suddenly, you're no longer looking at a transaction.
You're investigating the ecosystem around it.
That's the difference between network data and network intelligence.

Explore for yourself, today 👇
modo.link/
Understanding @CantonNetwork
What do validators actually do?
Validators help keep Canton Network running by confirming activity, maintaining the network and supporting consensus.
But not every validator is in the same state 👇

Live network data currently shows:
• 1,227 total validators
• 664 active validators
• 563 inactive validators
• 13 super validators
Understanding how validators are distributed provides another layer of insight into the network.
Explore live validator data with Modo 👇
cc.modo.link/mainnet/validat…
What makes @CantonNetwork different?
Most blockchains are designed around a shared, public ledger where every participant sees the same data.
Canton takes a different approach.
It enables applications to share and synchronise information with only the participants who need to see it—while still allowing assets and workflows to interact securely across the network.
That makes understanding the ecosystem about more than counting transactions.
It's about understanding the projects, participants and relationships that drive activity.
That's what Modo is built for 👇
modo.link/
This week's ecosystem insight 👇
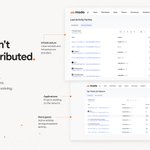
Activity across @CantonNetwork isn't evenly distributed.
Recent network activity is being driven by a mix of applications, infrastructure providers, participants and validators, not just a single part of the ecosystem.
Explore the data on Modo → cc.modo.link/mainnet/home


This week's ecosystem insight 👇
Network activity isn't evenly distributed.
Some projects, participants and infrastructure providers contribute significantly more activity than others.
Looking at the network through Modo helps identify where activity is concentrated – and how the ecosystem is evolving.
Because understanding where activity happens is just as important as knowing how much there is.

A blockchain can process millions of transactions.
That still doesn't tell you:
who generated them
what projects they're connected to
which infrastructure they're using
Context transforms blockchain data into ecosystem intelligence.
That's the difference between counting activity and understanding it.
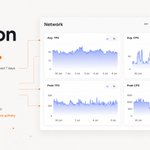
A quick snapshot of the performance across @CantonNetwork over the past 7 days.
• Avg TPS
• Avg CPS
• Peak TPS
• Peak CPS
Every metric tells part of the story.
Together, they reveal how network activity evolves over time.
Live data via Modo 👉 cc.modo.link/mainnet/analyti…

How do you research a project on @CantonNetwork?
Projects don't exist in isolation.
They're connected to tokens, participants, validators and applications across the ecosystem.
Here's how to explore those relationships in under 60 seconds 👇
Most explorers show activity.
But activity without context only tells part of the story.
10,000 transactions could come from:
• one application
• multiple applications
• infrastructure providers
• validators
• bridges
Understanding who generated the activity is what turns data into insight.
