

Swingtrader 🎯 • Student of the market 🤓 • Constructing my equity curve 🏗️ • I write about trading concepts 🤿
Netherlands
Joined May 2010
- Tweets1K
- Following263
- Followers456
- Likes863





Hey @AmeetRai, @RichardMoglen, will Journal module with AI make it possible to backtest certain rules/indicators on our own trades? Like what would my results have been if I sold 10% of my position at every ATR extension from the 50 day, vs waiting for a close below the 20 EMA.

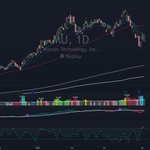
ADR extension from MAs indicator built on @Deepvue. Work inspired by @jfsrev's ATR extension indicator on Tradingview. With a few tweaks:
-Multiple MA's can be selected. This allows for visualisation of multiple extensions.
-Each extension can get different colorcoding. Makes sense to pick same color as MA (as in the screenshot).
-Both EMA and SMA can be used.
-Separate ADR multiples can be used for each extension. For example 3xADR from 20 EMA and 5x ADR from 50 SMA.
-Visualization can be plotted on the *absolute* extension level, instead of below or above the candle. This way the marker shows exactly at what price the extension was hit (also visible in the screenshot).
-Candle painting instead of different shaped markers can also be used but this looses the absolute level visualization.
Screenshot shows $NOW getting 3x ADR extended from the 20 EMA and 5x ADR from 50 SMA.


🔥🔥🔥

One of the most intellectually rewarding phases of the market are the “turning points”
These are points that rhyme with the past market conditions I’ve traded and where I can measure my own growth - not just by my P&L, but by how my decisions, reactions, and emotional control compare to prior cycles. These moments tend to put most participants offsides, and that’s exactly why they’re so revealing
If you study your emotions, your actions, and the instincts that flare up during these shifts, you start to recognize patterns.. subtle signals you completely missed in earlier years. Think of it as technical analysis of your own mind. There are patterns. You respond in a certain way in a certain tape
And so with enough cycles, you realize that the real separation between traders isn’t created during strong, obvious trends. Anyone can participate in momentum. The real difference shows up at the inflection points - when the trend is ending, when conditions are dynamic, when uncertainty is highest, and when clarity is nowhere to be found
The beauty of being a longterm student of the markets is that these moments repeat over and over in some shape or form. You begin to recognize echoes of past cycles, almost like familiar emotional fingerprints. And because turning points don’t happen often, each one becomes a yardstick - an honest piece of feedback from the market to you, about how far you’ve come and how much further you can go
There is no end to learning or improvement. You can always get better. You just need the right reasons to drive you.
The VXVCLS ticker doesn't exist in TradingView anymore. The alternative is VIX3M (ratio: VIX/VIX3M).

4. VIX/VXVCLS Ratio (Current Reading 0.85 - Tranquility)
$VIX is a useful chart, but VIX/VXYCLS Ratio can be more helpful as it filters out higher baseline readings on $VIX.
1. If it is greater than one, it implies uncertainty, negative for equities. On the contrary, such high reading (i.e. spikes) coincide with market bottoms.
2. If it is less than one, it implies tranquility, favorable for equities.
3. If it is below 0.82, the returns for S&P500 are often less than stellar.
Below I do a comparative of $VIX vs VIX/VXYCLS chart.


Maikel retweeted

Your Mind is Your Prison
Most traders fail not because they do not have a system and a set of rules, but they fail from mental exhaustion - constantly looking for validations, wanting to be right, and rushing to be profitable to prove that they are a successful trader.
A real successful trader does not need a flashy PnL to prove that he is successful. He is already successful in understanding himself and his system with utmost clarity and depth.
The market doesn't decide who he is, he enters the market only to execute his identity. Charts and PnL movements (and others' opinions) don't trigger his emotions, as he is only focusing on building results from calmly executing his edge when present.
That's what consistency and discipline is about, from understanding, and actually doing it.
Consistency is in your mind.
What are you in a hurry to prove this week?
That you can meet your weekly profit goal by Wednesday? That last month’s size is still the right size even though the action is more challenging? That sitting it out means you are falling behind your competition?
I have felt all of that in my early years, usually on a weekend, when the year suddenly feels like it is running away from me and the only fix is to press something NOW
Rushing size after a good stretch, rushing a make-back after a sloppy one, rushing a week that was never offering you much: those are different costumes on the same itch. The market does not owe you a complete allocation just because the calendar is moving
The traders who last are not the ones who extract a result from every session. They are the ones who can leave a week disappointed but still be the same level-headed person on Monday.
There is no rush. Don't be in a hurry to prove something. You have years to do this.


A sizing mistake can destroy a good system in one trade.
Proper sizing doesn't even need a lot of talent to execute, just a few well thought out rules that help you manage yourself.
Automate what doesn't need judgment, so your judgment is fully available for what does. Save the discretion for the fun part; stock selection, market analysis and entries.
The main goal of my system is not to predict direction more accurately. It's designed to survive being wrong about the direction entirely.
Prediction is discretionary.
Survival is mechanical.
Mixing the two is how blow ups happen.
A robust system doesn't care if your bets are right or wrong. It survives the bad times and thrives in the good times.
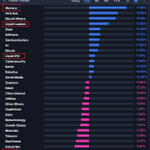
Shoutout to the @Deepvue team for making this happen; custom themes can now be added to the Theme Tracker widget!!
This implementation is even better than the 'theme tag' solution I proposed. Themes can be constructed by linking personal watchlists, screens and even ETF holdings(!) to themes.
I've added the Memory and Battery theme by linking them to the holdings of DRAM and BATT ETFs.
My Liquid Leaders and Liquid IPO screens are now also visible as themes.
Besides the obvious use case of finding strong themes, another fun use case would be to track the performance of weekly watch- and focuslists:
-Compare watchlists with the broader market to see if your selection is outperforming.
-Compare focuslists with watchlist to see if you're focussing on the right names.

There are so many paths your equity curve can take. Ideally you combine steep upward paths with shallow downward paths. Have rules in place to avoid steep downward paths at all times. This is non-negotiable.
Once you have that in place, allow for steep upward paths.