

Helping people live longer, healthier lives. Views my own. ❤️Serve one another in LOVE❤️
- Tweets2.9K
- Following126
- Followers1.3K
- Likes1.2K









ALT This is the screenshot of the output from mlarena's `evaluation` method for classification models. It includes key metrics such as AUC, MCC, precision, recall, F1, and F-beta (when beta is specified). The visual outputs feature a ROC-AUC curve (bottom left), a confusion matrix (bottom right), and a precision–recall–threshold plot at the top. In this top plot, precision (blue), recall (red), and F-beta (green, with β = 1 by default) are shown across different classification thresholds, with a vertical dotted line indicating the current threshold to highlight the trade-off. These visualizations are useful not only for technical diagnostics, but also for supporting discussions around threshold selection with domain experts (more on threshold optimization later).

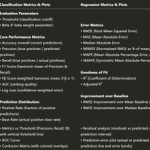
ALT an overview of MLarena’s evaluation reports for both classification and regression tasks
