

The Mid-Atlantic Regional Association Coastal Ocean Observing System, part of the @usioosgov system, powers understanding and prediction of the ocean and coasts
- Tweets1.4K
- Following435
- Followers761
- Likes648







ALT The image is a promotional poster for an event called "Catch the King: Tidal Flood Mapping Through Community Science." It features two people standing in tall grass near the water, observing their surroundings. The text describes the event as an opportunity for community scientists to gather important flood data along Virginia's coast. Logos for VIMS (Virginia Institute of Marine Science) and William & Mary appear at the bottom.

ALT This image shows a 'Catch the King: 2026 Virginia Tidal Flooding Calendar.' It highlights tidal events, including full moons, new moons, lunar perigees, and king tides. Each month from January to December is listed with symbols marking different tidal occurrences.

ALT Nine satellite maps display tidal flood mapping data from "Catch the King" events spanning from 2017 to 2025. Each map shows various colored markers representing different years of data collection along coastal areas. The top left includes a logo with a wave icon. The text reads, "Catch the King: Tidal Flood Mapping Through Community Science." A note below states, "Catch the King has been mapping king tides since 2017.

ALT A person stands at the water's edge using a smartphone. The screen shows a map app with a tidal flood mapping interface, part of the "Catch the King" project. A mobile phone mockup displays a detailed map on the lower right. Text invites volunteers to register for the mapping initiative.


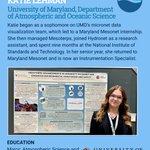
ALT The poster is titled "Mesoterps: Advancements in University of Maryland's Mesonet," focusing on enhanced environmental monitoring and safety. The text includes information about a student, Katie Lehman, involved in atmospheric research and data visualization at the University of Maryland, where they are now an Instrumentation Specialist.

ALT Text on the image mentions Katie Lehman from the University of Maryland, Department of Atmospheric and Oceanic Science, along with a quote about environmental monitoring.

ALT Text provides advice for undergraduate students to use resources, join student groups, and engage in hands-on projects for experience and opportunities. It also encourages community members to document hyper-local flooding, collect data, and support the community with identifying necessary resources.

ALT A person wearing a Hydronet Systems shirt is using a scientific instrument near a body of water. The image includes text about studies at the University of Maryland, Department of Atmospheric and Oceanic Science, and mentions motivation and career aspirations.


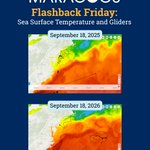
ALT Two maps display sea surface temperatures and glider paths for MARACOOS. The top map is dated September 18, 2025, and the bottom one is dated September 18, 2026.

ALT Satellite map showing storm tracking in the Mid-Atlantic region with path lines and markers. The map is associated with MARACOOS and mentions "Storm Tracking with OceansMap."

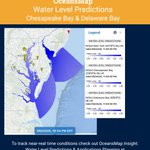
ALT A digital map interface from MARACOOS OceansMap shows tracked storm paths along the East Coast. The sidebar lists data layers such as cyclone predictions and coastal conditions. The text explains that the map helps in tracking storms and assessing coastal risks. It suggests actions like viewing storm predictions, checking wave height, exploring surge and tide predictions, and using multiple data layers. Logos for MARACOOS and IOOS Association appear at the bottom.

ALT The image features a promotional graphic for OceansMap Insight by MARACOOS and IOOS Association. It highlights an interactive view for monitoring information before and during a storm. A screenshot showcases data layers on a map of the Atlantic Ocean, with various options for monitoring systems and regions. Logos for OceansMap, MARACOOS, and IOOS Association are included at the bottom.
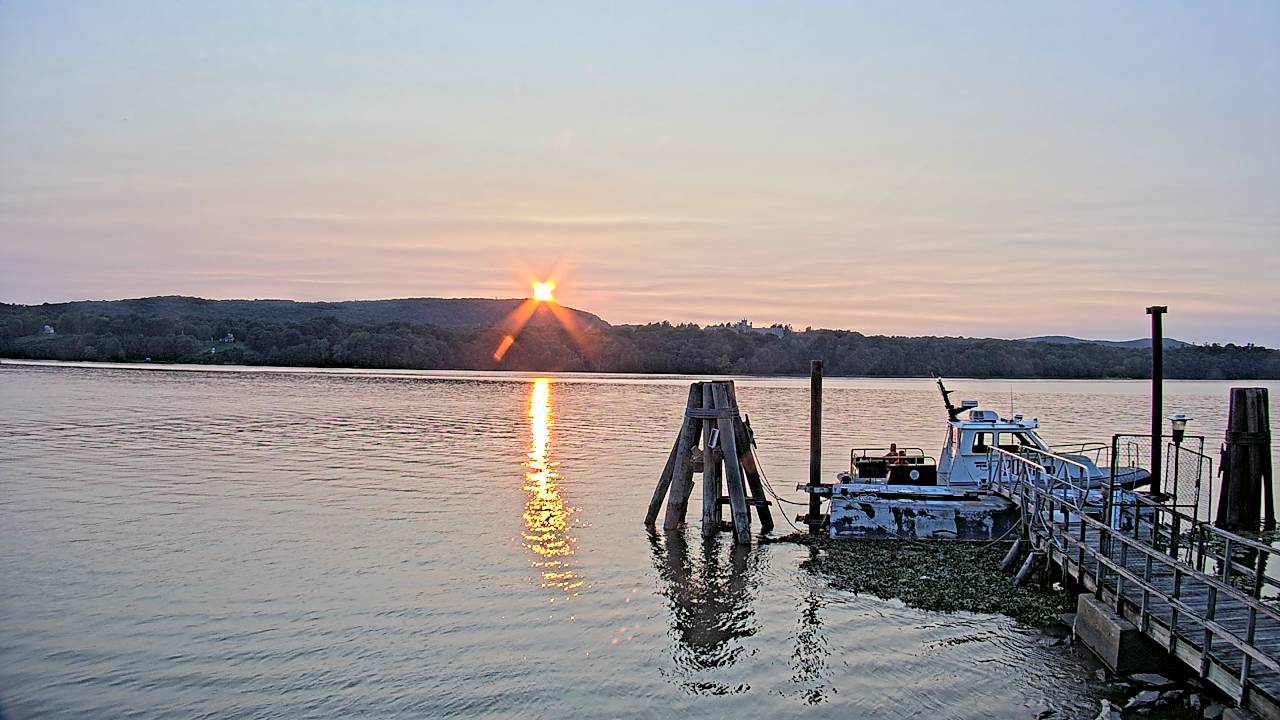


ALT A close-up of a hawk peering into the camera, from webcam at Robert Moses State Park.


