

Designs learning materials. Drives up and down motorways. Dissects health service data. Delivers training courses. Draws graphs.
Edinburgh, UK
Joined December 2008
- Tweets12.1K
- Following3.1K
- Followers1.7K
- Likes8.6K


This is a really interesting talk on silos by @gilliantett. I particularly like the bit between 39:00 and 44:00 when she talks specifically about how data can be analysed in ways that make clear the relationship between different silos.
youtube.com/watch?v=Avi9xfoJ…
On Reporting Scotland just now, John Swinney looks clueless in response to @GlennBBC's questions about corridor care and winter pressures. No wonder @VP_Scot_RCEM is livid.
Taking inspiration from John Donne's poem To His Mistress Going to Bed for a control chart =IF() statement in Microsoft Excel. As one does.
=IF(AND(C2>=H2,C2<=I2),"BETWEEN",IF(C2>I2,"ABOVE",IF(C2<H2,"BELOW","")))


I want to find a way of measuring bed occupancy in a way that's *patient*-centred as opposed to ward-centred. Maybe by measuring the average number of beds occupied in the ward, but just for the duration of a particular patient's stay. Bed occupancy as witnessed by the patient.


I have rashly volunteered to do a talk at the next EdinbR meeting (on 21st October). I'm calling it "For a Few Dollars More", and I'm asking the question: "Can we use the language conventions of R to help develop our thinking about whole system problems?"
#rstats


Neil Pettinger retweeted

India v West Indies is the first ODI, and only the second List-A one day match, to contain five centuries. stats.cricinfo.com/ci/engine…
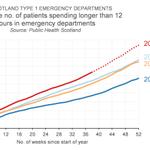
I had the idea of visualizing the trend in >12-hour ED stays in the same way the BBC visualizes small boat arrivals. So these are cumulative weekly totals for each (colour-coded) year as we move from left to right. The projection for the remaining 14 weeks of 2026 is mine.

Source of the data is here: publichealthscotland.scot/he…
The years aren't quite years: they're 52-week periods:
2 Jan 2023 to 31 Jan 2023
1 Jan 2024 to 29 Dec 2024
30 Dec 2024 to 28 Dec 2025
29 Dec 2025 to 20 Sep 2026 (the current year)
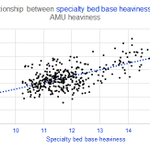
Along with @ProfDerekBell, I'll be presenting data on heaviness at #SAMGlasgow at the end of next week, in a session chaired by @nickscr1. Are there ways of presenting data on specialty bed base heaviness that might enable clinical teams to consider improvement possibilities?

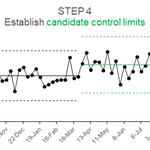
I've been working my way through the Stable Shift Algorithm. There's an #rstats package {autospc} that does this, but I wanted to go through the steps for myself in Excel. Here's the article about it by Tom Woodcock, Imogen O'Connor and @ProfDerekBell: qualitysafety.bmj.com/conten…

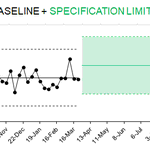
I've designed a new training course that I've called *Intentional* SPC. It's based on the idea that if you're serious about improving a process, you'll want to declare your intentions - using specification limits - before you take steps to improve it.

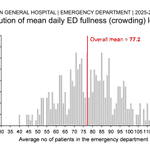
Excel doesn't make it easy to superimpose a vertical 'overall mean' line on a histogram so that it hits the x-axis at just the right place.

Just been to the cinema to see Pressure. Really good. Made me want to believe that the D in D-Day stood for data!

When we think about performance management information, we focus on the information itself. We ask: Is it the right metric? Is the data accurate? Is it visualized appropriately?
We hardly ever think about the forum in which the information needs to be presented and discussed.
Neil Pettinger retweeted

An NAO report this month said the latest NHSE strategy to improve emergency care wasn't working. I thought it might be worth looking at previous strategies. Here is a start:
...

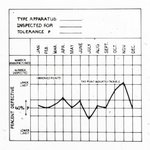
This morning I taught Part 1 of Intentional SPC to a group of @NHSGGC staff. This is a new course, designed for healthcare analysts who want to use SPC purposefully, with the same *intent* that Walter Shewhart brought to bear on the issues back in May 1924 when he invented SPC.
