

Liquidity Trader | 8+ Years Market Structure • Order Flow • Liquidity Precision Entries & Institutional Flow Signals → https://xitter.cf/t.co/3pohatnrSA
İletişim/İşbirliği için DM 📩
Joined January 2021
- Tweets34.6K
- Following1.8K
- Followers35.4K
- Likes121K


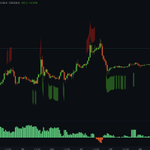
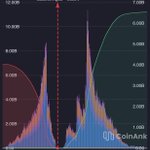
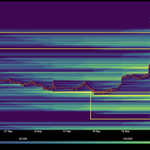
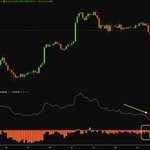
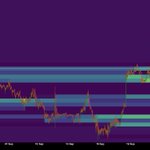
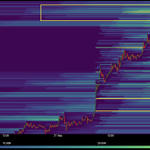

The picture for #Bitcoin is becoming increasingly clear.
While the price attempts to hold its ground, liquidity pools on the downside have grown significantly.
The market will not ignore such substantial liquidity for long.
There is a significant accumulation of liquidity, particularly around the $80,000, $78,000, and $76,000 levels.

#BTC There are strong sell bands between 87.1K and 88.5K.
At the same time, OB Depth 5% has dropped to -0.044, moving back into negative territory.
If spot buyers don’t step in, this zone could continue to cap price in the short term.

New accounts open with up to 10,520 USDT behind them. 500 USDT position airdrop on your first trade, plus $HYPE on futures volume.
Closes 23 October.
👇 bitbase.com/accounts/invite/…

#BTC There are strong sell bands between 87.1K and 88.5K.
At the same time, OB Depth 5% has dropped to -0.044, moving back into negative territory.
If spot buyers don’t step in, this zone could continue to cap price in the short term.
I’m watching BTC’s $85–86K zone, where the strongest concentration sits on the chart. Below, I’m keeping an eye on $81–82K.
I expect the upper cluster to be tested first. If we get there, the price reaction will be key
#BTC

I’m watching BTC’s $85–86K zone, where the strongest concentration sits on the chart. Below, I’m keeping an eye on $81–82K.
I expect the upper cluster to be tested first. If we get there, the price reaction will be key
#BTC
BTC Liquidity Heat Map
BTC is sitting between two major liquidity pools.
Heavy liquidity is stacked above around 90K–96K, while another large pool sits below around 66K–75K.
Price usually moves where liquidity is waiting.
A bigger move looks like it’s loading #Bitcoin

BTC Liquidity Heat Map
BTC is sitting between two major liquidity pools.
Heavy liquidity is stacked above around 90K–96K, while another large pool sits below around 66K–75K.
Price usually moves where liquidity is waiting.
A bigger move looks like it’s loading #Bitcoin
BTC spot flow still looks weak.
While price is holding around 83.5K, Aggregated Spot CVD has dropped to -1.021B.
Coinbase Premium is also in negative territory at -0.0182.
So even though price is moving sideways, spot demand still isn’t strengthening. If this divergence continues, the pressure could increase #BTC
BTC POSITION HEATMAP
Price is now trading directly into one of the heaviest existing position clusters around 81.5K.
This is the key zone to watch. How BTC reacts here should matter more than chasing the move #BTC

BTC POSITION HEATMAP
Price is now trading directly into one of the heaviest existing position clusters around 81.5K.
This is the key zone to watch. How BTC reacts here should matter more than chasing the move #BTC
BTC/USD – LIQUIDITY HEATMAP
Heavy liquidity is building up around $88.3K–$89.3K.
I’m expecting a sharp move into that zone to sweep the liquidity, followed by a move toward lower levels.
If we get that pullback, I’ll be watching $83K and $82.2K closely #Bitcoin

BTC/USD – LIQUIDITY HEATMAP
Heavy liquidity is building up around $88.3K–$89.3K.
I’m expecting a sharp move into that zone to sweep the liquidity, followed by a move toward lower levels.
If we get that pullback, I’ll be watching $83K and $82.2K closely #Bitcoin
$BTC Open Interest is approaching previous peak levels, signaling a massive buildup of positions.Strong spot sell walls formed around $83,000. Following a sharp rally, BTC pulled back toward $80,000.
OI remains elevated. Volatility risk persists until this crowded positioning unwinds.


$BTC Open Interest is approaching previous peak levels, signaling a massive buildup of positions.Strong spot sell walls formed around $83,000. Following a sharp rally, BTC pulled back toward $80,000.
OI remains elevated. Volatility risk persists until this crowded positioning unwinds.
#BTC LIQUIDATION MAP
Bitcoin is currently trading at $78,118. More than $5 billion in liquidation liquidity is concentrated below, particularly between $74,500 and $75,500.
Above the price, the $78,900 and $79,800 levels stand out. The largest liquidity pool remains below.

BTC is climbing, but liquidity is building up rapidly below.
Major clusters are forming around $74.5K–$75K and $73K.
The rally may continue, but the growing liquidity below raises the possibility of a downside sweep #Bitcoin

BTC is climbing, but liquidity is building up rapidly below.
Major clusters are forming around $74.5K–$75K and $73K.
The rally may continue, but the growing liquidity below raises the possibility of a downside sweep #Bitcoin
BTC/USD | Spot selling pressure continues.
Spot CVD has dropped to -$1.05B, while Coinbase Premium sits at -0.10%.
BTC has recovered above $76,800, but spot buyers are still missing. I want to see spot inflows before trusting a sustained rally #Bitcoin

BTC/USD | Spot selling pressure continues.
Spot CVD has dropped to -$1.05B, while Coinbase Premium sits at -0.10%.
BTC has recovered above $76,800, but spot buyers are still missing. I want to see spot inflows before trusting a sustained rally #Bitcoin
BTC LIQUIDITY HEATMAP #Bitcoin
Looking at the monthly picture, much of the short-term liquidity above has already been cleared. After sweeping the $78K–$80K range, BTC has moved back toward the heavy liquidity clusters below.
The key area right now is $75K–$76K, where price has already tapped into the liquidity.
On the monthly heatmap, major liquidation clusters remain at $70K–$71K and $63K–$64K below.
Above, the $85K–$86K and $93K–$94K zones stand out.
The takeaway: Short-term liquidity above has been swept, but BTC is still trading between massive liquidity magnets on both sides.
Large-scale spot outflows are clearly coming from Coinbase.
Ahead of the Fed rate decision, the US side is reducing risk. While flows on other exchanges remain relatively limited, the fact that the main selling pressure is coming from Coinbase suggests that institutional participants are still staying cautious.
If this selling flow does not slow down after the Fed decision, downside pressure on the market could continue for a while longer. #Bitcoin
BTC USD
Price is trying to hold, but selling pressure on the spot side keeps increasing. Spot CVD has dropped to -$574M, while the Coinbase Premium remains negative.
US demand is still weak. Until spot buying returns, it’s hard to trust any strong recovery #Bitcoin

BTC USD
Price is trying to hold, but selling pressure on the spot side keeps increasing. Spot CVD has dropped to -$574M, while the Coinbase Premium remains negative.
US demand is still weak. Until spot buying returns, it’s hard to trust any strong recovery #Bitcoin
#BTC USD LIQUIDITY HEATMAP
Price is approaching the $76,000 region again. The largest liquidity clusters on the map are located around $76,000 and $80,000. We’ll watch the reaction at these two levels for the next short-term direction.

#BTC/USD RETAIL LONG/SHORT DATA
Following the $82,000 peak, the whale ratio dropped from 22 to 8.800. During this period, retail longs continued to dominate the market at 69.3%, showing no change despite the decline in the whale ratio. A larger drop and liquidation flush are needed.

#BTC/USD RETAIL LONG/SHORT DATA
Following the $82,000 peak, the whale ratio dropped from 22 to 8.800. During this period, retail longs continued to dominate the market at 69.3%, showing no change despite the decline in the whale ratio. A larger drop and liquidation flush are needed.
BTC USD Liquidity Heat Map
The 75,000$ area stands out on the heat map. Liquidity below is still strong, and I’m watching closely to see how price reacts around these zones. #Bitcoin

BTC USD Liquidity Heat Map
The 75,000$ area stands out on the heat map. Liquidity below is still strong, and I’m watching closely to see how price reacts around these zones. #Bitcoin
#BTC Spot selling pressure remains strong.
Negative Spot Delta is especially noticeable on Coinbase and Binance. Until we see fresh and sustained spot inflows, I don’t expect any lasting strength in the market.
The market may remain weak until spot demand returns.
