

Pizzeria Owner/Landlord/Breast Cancer Warrior/Chartist & Trader of Stock Market/Post $NASDAQ Chart Daily/WON'T DM YOU
Show Me State, USA
Joined July 2017
- Tweets26.5K
- Following766
- Followers7.6K
- Likes97.7K




Pinned Tweet
How to read my charts:
BB=Bollinger Band
upper & lower BB=solid yellow
mid BB=dashed yellow
EMA=Exponential Moving Average
13EMA=blue, 50EMA=purple, 200EMA=green
TL=Trendline
MOMO=Momentum
MACD=MOMO indicator
STOCH=Stochastic MOMO indicator
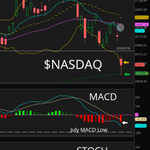
$NASDAQ DAILY chart for Friday
Opened gap down below 25802 & followed lower BB down all the way down 2 the 200EMA green 25212 then bounced
So far 200EMA green holding as support, but will it next week
13EMA blue/50EMA purple Bull cross averted (shaded oval)
Lower BB pointing down isn't a good sign, still allows 4 more down side
MACD racing downward isn't good but still above the July MACD low (dash line)
STOCH holding below 50 dash line isn't good, breaking back below 20 line would be really Bearish


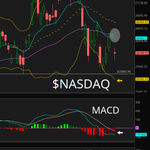
$NASDAQ DAILY chart for Thursday
Today's price action helps avert the 13EMA blue/50EMA Bull cross (shaded oval)
Lower BB pointing down means door is open 4 price 2 go down more if wants
Breaking Low 25802 wouldn't be good, Bulls really need a higher low here
MACD keeping its gap wide and still racing downward isn't good
STOCH if turns here or before 50 dash line is bearish
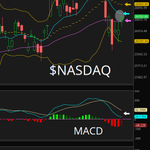
$NASDAQ DAILY chart for Tuesday
Got the 13EMA blue back test & even back tested 50EMA purple but unable 2 close over both EMA
Another huge green day would help the 13EMA blue rapid recross 50EMA which is extremely bullish. The FOMC decision will help this rapid recross or avert it.
MACD fully crossing centerline isn't good but if it can turn here than that would be good
STOCH crossed and starting 2 break 20 line is good sign, needs 2 fully break above & race upward
It all depends on the reaction 2 the FOMC decision that's tomorrow.
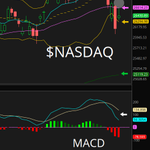
$NASDAQ DAILY chart for Monday
13EMA blue/50EMA purple Bear cross happened, looks like Bears were trying 2 avert it but unable 2
Price still holding above last low 258025 which is good
MACD still racing across centerline isn't good sign
STOCH fully under 20 line isn't good
Could really go either way ...either back test 13EMA blue 26505 or test last low 25802
$NASDAQ DAILY chart from Friday
Price following lower BB down
13EMA blue touching 50EMA purple, Bulls need some serious green days 2 still avert or minimize the 13EMA blue/50EMA purple Bear cross (shaded oval)
MACD racing across centerline isn't good
STOCH hanging around 20 line isn't good

$NASDAQ DAILY chart from Friday
Price following lower BB down
13EMA blue touching 50EMA purple, Bulls need some serious green days 2 still avert or minimize the 13EMA blue/50EMA purple Bear cross (shaded oval)
MACD racing across centerline isn't good
STOCH hanging around 20 line isn't good
$NASDAQ DAILY chart for Thursday
...and just like that, a false reclaim of 50EMA purple
Gap down continued red pushes lower BB down opening trap door 4 price 2 go down more if wants
Today's huge red day also helps the 13EMA blue bear cross 50EMA purple (shaded oval) def need more red though 4 Bear cross 2 happen
MACD gaining speed & starting 2 cross centerline isn't good
STOCH if it dips back under 20, that isn't good
$NASDAQ DAILY chart for Wednesday
Price finally reclaimed 50EMA purple 26610 is good
Today's green helps avert the 13EMA blue/50EMA purple Bear cross from happening (shaded oval)
Now Bulls need 2 close above 13EMa blue 26772 then mid BB 26963 2 fully avert the Bear cross & help the 13EMA blue/mid BB Bull cross that could happen
MACD turning before or at purple centerline is/would be good
STOCH already back above 20 line is good sign, Bulls need it 2 race upward now
$NASDAQ DAILY chart for Monday
Tested 50EMA purple & failed, Bulls really need green & 2 recover 50EMA purple on a close 2 avert the 13EMA blue/50EMA purple Bear cross (shaded oval)
Lower BB still pointing down isn't good
MACD still racing downward isn't good but still above centerline, Bulls want 2 hold above centerline
STOCH turning here at 20 line would be good, let's see if it can
$NASDAQ DAILY chart for Friday
Well my last post before I went on vacation stated the candle looked like a topping candle & it was!
Price has lost all supports including 50EMA purple which is not good & Bulls need 2 regain it ASAP
13EMA blue has Bear crossed mid BB (shaded oval) now will 13EMA blue Bear cross 50EMA purple or will they avert that Bear cross?
If we do have 13EMA blue/50EMA purple, price should see 200EMA green below
Today's red price action has pushed lower BB downward opening trap door 4 price 2 go lower if wants
MACD racing downward isn't good. Bears really need it 2 race below purple centerline
STOCH starting 2 break below 20 line isn't good
$NASDAQ DAILY chart from Tuesday
🚨I going on vacation, so no $NASDAQ chart till I get back🚨
Price following upper BB up
Showing a topping candle, but I don't see anything in the momentum indicators, so we will see
Upper BB & 13EMA blue still pointing upward is good
MACD gap wide racing upward is good
STOCH fully broke above 80 line is good

ChartingKatrina❤️🔥🎀 retweeted

#ES_F tagged 7870-7880 and broke it. 7945 T target is in sight now.
That T target lines up with the upper band, where these moves like to stall. I think da boyz pull back first to trap more shorts, then squeeze.
Yesterday 7815-7820 level hit to the tick and bounced. I still want a test of 7790-7810. ES loves those round numbers. Example (7800, 7700, 7600 etc...)
7750 is very strong support could possibly see a wick to that level (Stop Run). That puts price into the lower bands and where those previous bazooka blocks showed up in ES.
Get back above 7840 and 7870 comes back into play. Then the squeeze into 7945. Upside stays intact until 7790-7810 fails.
Full breakdown is in the video below on ES.
Do we dip into 7790-7810 first or squeeze straight into 7945?
$NASDAQ DAILY chart from Tuesday
🚨I going on vacation, so no $NASDAQ chart till I get back🚨
Price following upper BB up
Showing a topping candle, but I don't see anything in the momentum indicators, so we will see
Upper BB & 13EMA blue still pointing upward is good
MACD gap wide racing upward is good
STOCH fully broke above 80 line is good
$NASDAQ DAILY chart from Monday
New ATH that closed above old ATH 27288 that is now support & also 13EMA blue
Price following upper BB up since the window🪟was opened
13EMA blue pointing upward is good
MACD racing upward is good
STOCH turning & breaking 80 line is good, needs 2 fully break above 80 line
$NASDAQ DAILY chart from Friday
Price made a new ATH regaining & closing over the ATH from June 1st. Now it needs 2 close over the last ATH 27288 from a week ago & follow upper BB up
MACD gap increased is good sign
STOCH turning is good sign, needs 2 break back above 80 line

$NASDAQ DAILY chart from Friday
Price made a new ATH regaining & closing over the ATH from June 1st. Now it needs 2 close over the last ATH 27288 from a week ago & follow upper BB up
MACD gap increased is good sign
STOCH turning is good sign, needs 2 break back above 80 line
solana:nasd9ZCaNtC3wZ4G7updmA48VGmcgyNnXsYQ6cRLkjP DAILY chart from Thursday
Really no change, price still holding 13EMA blue support
MACD not racing upward & that's what Bulls need
STOCH turning here would be good but lines need 2 cross and break above 80 line

$NASDAQ DAILY for Wednesday
Even with the EOD sell-off, price still holding above 13EMA blue support
Bulls need 2 break above old ATH 27190 or Bears need 2 lose 13EMA blue 26742
MACD still turning sideways not good MOMO
STOCH fully broke below 80 line isn't good, but Bears need it 2 really race downward more not so sideways
$NASDAQ DAILY for Monday
Got the 13 EMA blue backtest & price held at the close so no supports broke
Bulls need 2 hold above 13EMA blue & break the old ATH 27190 & even the new ATH 27288
Bears need 2 lose 13EMA blue 26710 & also mid BB 26504
MACD turning hear would show Bearish Reversal Divergence (white dash lines)
STOCH starting 2 dip under the 80 line isn't good
$NASDAQ DAILY chart for Thursday
I'm getting old & forgetful! I thought I posted Wednesday's chart lol
Wednesday showed a false breakout of old ATH just FYI
Today opened gap down but filled the gap
Price still holding above 13EMA blue 26629 support which is good, needs 2 break & hold the old ATH 27190
MACD is alright, could use more racing upward
STOCH above 80 line is good needs 2 stay above it
$NASDAQ DAILY chart for Tuesday
Price made new ATH & closed above old ATH is good
Upper BB is pointing up is good but price is well out of upper BB & will eventually have 2 get back with in it
13EMA blue is pointing upward is good
MACD starting 2 race upward is good
STOCH starting 2 break 80 line is good, needs 2 fully break above 80 line
