





QuantCat retweeted

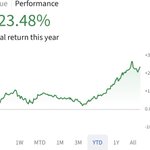
Portfolio just hit a new ATH. Thx everyone who made this possible, especially Andy`s 11:
@BerkelKip
@EightTrack180
@SebKrog
@AmsterdamStocks
@gezzogero
@david_katunaric
@dsmoak98
@JoeValue
@finance_schmidt
@ValueIsaac2002
@Thijsbuitenhuis
Suggest following them all!
QuantCat retweeted

This chart is showing a classic late-cycle / speculative momentum setup becoming increasingly unstable.
Similar markets in:
* late 1999 / early 2000 momentum exhaustion
* late 2021 speculative growth blowoff
* mini-versions in 2018 and 2020
You’re unable to view this Post because this account owner limits who can view their Posts. Learn more
QuantCat retweeted
High Beta versus Low Volatility screams to a new all-time high.
The ratio measures risk appetite:
* Rising ratio → High Beta outperforming Low Vol, i.e., a “risk-on” regime.
* Falling ratio → Low Vol outperforming, i.e., “risk-off” or defensive positioning.
In the long-run, Low Volatility > High Beta.
The ratio Is at a multi-decade high.
The current reading exceeds prior peaks:
* 2007 peak (right before the GFC)
* 2018–2021 meme-stock peak
* 2023–2024 AI boom
Today's level is the highest since at least 2006.


Similarly, the riskier High Beta index has been outperforming the boring Low Volatility index.
This is likely due to the composition of the High Beta index, which, as my amigo @QuietProsperity points out, holds the profitable semi complex while Low Volatility holds some expensive staples/industrials etc.


QuantCat retweeted

If you invest for yourself read my speculations
Gold & silver jr with forward P/e below 3.5 with current spot gold and silver prices. 40mil debt. 160mil USD cash quarter-to-date. Adding 1% of the market cap to cash on hand per 9 days. 40 days to cover on the 10mil short position


QuantCat retweeted

Unprofitable Tech vs S&P 500 (from Goldman)
currently in a 43% relative rally just since the start of July.


QuantCat retweeted

Looking at Palantir’s -📈 $PLTR - latest deck.
It hypes the “Rule of 40” (growth + margin) as a magic filter—yet the top-rated stocks lag the market.
investors.palantir.com/files…
Slick marketing, shaky results.


QuantCat retweeted

You have value, you have growth and then you have GARP. Peter Lynch popularized Growth At a Reasonable Price using the PEG ratio. But was that the best way?
The PEG ratio compares the PE ratio (price to earnings) to the growth rate. Generally speaking, you would like the ratio to be around 1 where the PE ratio is roughly similar to growth.
This simple ratio will help you with the following:
🔹 Avoid Overpaying for Growth
🔹 Ability to Compare Companies Across Industries
🔹 Simplicity
However, the PEG ratio also has its downfalls such as the following:
🔸 Future growth estimates could be inaccurate
🔸 Historical growth rates might not predict future growth
🔸 PE is too simple a measure of a firm's value
🔸 Hyper-focus on earnings discounts other forms of growth
What if a company had a one-time spike in earnings? What if they are growing revenues at a record pace and later on will tighten up margins for earnings growth? Is growth being funded through debt? Is the company trading at a massive discount due to risk (think tariffs)?
When analyzing stocks, we need to be as complex as necessary but as simple as possible. The PEG ratio is perhaps too simple a tool to use in isolation.
Another more elegant way is to develop a ranking or grading system for stocks based on value and growth factors.
➡️ We will assign 50% weight to numerous valuation factors including free cashflows, sales, book value, and earnings.
➡️ We will assign 50% weight to numerous growth factors such as sales, earnings and operating income. We consider not only trailing growth but the acceleration of growth.
Sound difficult? At Portfolio123 we have pre-built core ranking systems for such styles as value, growth, sentiment, low volatility, earnings quality and momentum. You simply copy and paste the styles you want into a new ranking system, modify it and in a minute, you are ready with your GARP trading system.
Let’s compare using a simple test.
▶️ Russell 3000 index
▶️ Backtest from 1999 until today
▶️ 4-week rebalancing
▶️Top 100 stocks using the PEG ratio
▶️Top 100 stocks using the value/growth ranking system
The simple PEG ratio results in 11.79% CAGR. The identical set-up using the Portfolio123 ranking system has almost 2x the CAGR clocking in at 21.82% with over twice the Sharpe Ratio.
The conclusion is clear – the PEG ratio is simple…too simple for today’s market.

QuantCat retweeted

this screen puzzles me..., super simple! PiotFScore >= 5
Close(0, GetSeries("SPY")) > SMA(200, 0, GetSeries("SPY"))
Ranking System --> Core Sentiment
10 Stocks, Rank Tolerance 20% (always use rank tollerance, it is on the Backtest Tab --> means Stocks need to lose 20% of its initial rank before the screen sells, this is how you build systems versus screens)
@P123Finance


QuantCat retweeted

I keep reading white papers about how momentum is like the 9th wonder of the world.
Its outperformance dates back to the Roman Empire.
It works in all markets globally and possibly the solar system.
Then I realistically model it and get the red line below. 🤷♂️

QuantCat retweeted
Here a naive screen of the "cheapest" Italian names by my Value Composite (major multiples mashed together) which also have negative 36-month performance. Not my thing since I like my cheap junk with momentum (e.g. Sogefi). But nothing to say against small dirtcheap standalone.

QuantCat retweeted

(🧵)Baby GUTS for #microcaps
I'd like to share a version of my personal microcaps strategy with everyone.
A relatively simple quantitative strategy that uses the main factors from GUTS:
➡️Growth
➡️Undervalued
➡️Timing
➡️Sentiment
A public simulation at Portfolio123:
(2/n)
👇
QuantCat retweeted

$CASH A favorite financial of mine reported another solid quarter tonight. CASH bought back 765k shares at $51.20. That represents 3% of the outstanding shares. Lending results were excellent and earnings were $2.56 per share. CASH confirmed 2024 earnings of $6.45 at midpoint.
QuantCat retweeted

Taiga Building Product $TBL.TO is too cheap to ignore
Canadian building product distributor with $350M market cap, no debt and $150M (!) in cash sitting on the balance sheet. They paid a special $0.23/share dividend last December and I would not be surprised to see them increasing capital return in the coming years
In 2023, they generated $61M in net income (down from ~$90M in the boom years of 2022-23) and $103M in free cash flow. Business is highly cash generative and consistently deliver double-digit ROIC
With >75% held by insiders, the stock is thinly traded and not on the radar of institutions which creates the opportunity for small investors to invest at a bargain price

QuantCat retweeted
RIP Danny Kahneman.
I owe much to Danny and his partner Amos Taversky for their work on prospect theory & behavioural biases, and in particular their excellent book “Thinking Fast & Slow”.
Informed much of my approach to quant investing.

QuantCat retweeted
Gung Ho Entertainment $3765:
Equity = 150 billion yen
Cash pile = 135 billion yen
Equity - cash pile = 15 billion yen
Last year's net income = 22 billion yen
The ROE on the underlying biz is completely insane. Video game companies are amongst the best quality possible.