

very into dashboards & snowboards
- Tweets147
- Following357
- Followers350
- Likes1.1K





ALT A photo of the Hungarian Parliament building featuring a drawn arrow pointing to it and a handwritten note that reads: I was there.

ALT A close-up photo of me presenting at the Parliament, with white illustrations in the background symbolizing various aspects of accessibility.

ALT A photo of me with two other presenters in the Parliament, with a thought bubble drawn above my head as a joke, showing that I’m thinking about cats and palm trees.

ALT A wide-shot photo of me presenting at the Parliament, with the audience in view. The screen has been altered to display a drawing that says "A11Y," and there are outline sketches around the audience members.


ALT A blue drawing of the Hungarian Parliament set against a light green background.

ALT A blue drawing of the Hungarian Parliament set against a light green background.

ALT A selfie in the elegant elevator of the Parliament, which resembles a room, taken by me in the mirror. The mirror features doodles highlighting the red carpet, indicating that the first floor is the top, with up and down arrows, and a thought bubble with me thinking: 'There's no way this moves.'


ALT The Nightingale magazine's newest edition sitting on a table, with a ski slope in the background.

ALT The Nightingale magazine's newest edition in my hand, in front of the Osaka skyline around sunset.

ALT The Nightingale magazine's newest edition in my brother's hand on a rainy day, with my father holding an umbrella over it, in front of one of Kyoto's iconic shrines.

ALT The Nightingale magazine's newest edition out of focus, behind a blossoming cherry blossom tree in Himeji.

ALT The Nightingale magazine's newest edition in my hand, in front of Tokyo's iconic and busy Shibuya crossing.

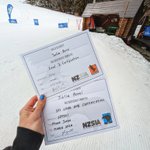
ALT A hand holding two certificates in front of a ski slope, one saying: 'Level 1 ski instructor', the other 'Level 2 snowboard instructor'. Both are qualifications received from the New Zealand Snowsports Instructors Alliance in Japan (Hakuba Iimori and Myoko).


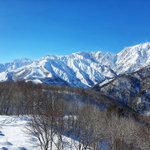
ALT View of snow covered mountains in Hakuba Valley


ALT 3 different circular chart variations using the area visual code are compared: the pie chart, the moon chart and the moonpie chart. All chart types are shown with different values: 25%, 50%, 75% and 100% to make the visual comparison easier.