
Jonas Schöley, PhD | Research Scientist @MPIDRnews | Demography and Data Viz
Joined June 2017
- Tweets1.8K
- Following446
- Followers1.4K
- Likes4.5K




Pinned Tweet
Life-expectancy drop in 2020 compared to previous years. Another look at the results of our forthcoming IJE paper. @OxfordDemSci @CPop_SDU #rstats Code: github.com/jschoeley/de0anim
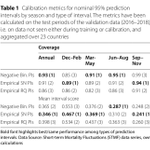
Winter's coming and with it a higher likelihood for weekly excess deaths–even in the absence of a pandemic. In her 1. publication my PhD student @DuerstRicarda applied conformal prediction to estimate the seasonal distribution of "expected" excess deaths. doi.org/10.1186/s12963-024-0…

Most excess analyses ignore the seasonality of the prediction error to the detriment of inference. We show that by ignoring this seasonality one is insensitive towards significant excess deaths in Spring/Fall while excesses in winter show up as more unusual than they are.


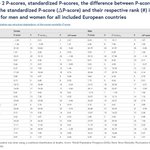
Excess death P-scores are often used for country rankings despite being biased by age structure. @nkls_ullrich and I looked at the bias closely and found it to be...
pophealthmetrics.biomedcentr…

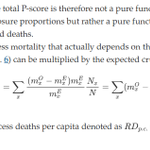
The P-score and per capita excess mortality are closely related. Multiplying a P-score with the crude death rate under the expected scenario yields the per capita excess death rate which, unlike the P-score, is weighted by the living population.

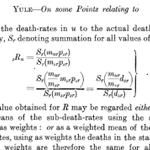
This started as a discussion with @ArielKarlinsky and @hippopedoid a year ago: xitter.cf/jschoeley/status/16671…

The excess mortality P-score depends on the age-structure of a population, except for the case, where mortality rates are increased by a constant factor over age compared to the expected scenario. Would you check my math? github.com/jschoeley/adps/bl…

There's still some time to submit an abstract to the DGD Meeting in Hamburg 2024. I co-chair a session on C19 mortality in the Nordic countries and Germany. dgd-online.de/jahrestagung/j…
Naming your algorithm AEnbMIMOCQR takes either an incredibly systematic or relentlessly sarcastic mind. Love it.

Delighted to see that Schöley & Willekens (2017) has helped to inspire these amazing explainers by @OurWorldInData and @flowingdata causes of death. Let me introduce you to our paper "Visualizing compositional data on the Lexis surface" (citations help) demographic-research.org/vol…🧵

Really cool to see @flowingdata's new heatmaps on how causes of death have changed over time in the US. flowingdata.com/2023/09/29/a…
It's inspired by/adapted from my code (which itself was adapted from @jschoeley's code!)


Finally, small multiples of cause of death % by age and time with the areas where a cause was most dominant highlighted. Fun fact, back then I used a spatial analysis package in order to calculate and plot the black outline, treating the Lexis surface as flat geo-coordinates.

I shared the code back then (re:upload github.com/jschoeley/viscomp…) and it inspired a bunch of further viz😍 @jburnmurdoch cited Schöley & Willekens (2017) in the FT. As citations are my currency please do so too, if you got inspired by our paper or code. ft.com/content/92007e1c-d42c…
