

Early-stage data partner helping founders scale faster & smarter | Find bugs, fix bottlenecks, raise funding | Fractional data leadership at startup prices
Denver, CO
Joined July 2011
- Tweets590
- Following245
- Followers319
- Likes799




Pinned Tweet
𝐒𝐭𝐚𝐫𝐭𝐮𝐩𝐬 𝐝𝐨𝐧'𝐭 𝐧𝐞𝐞𝐝 𝐚𝐝𝐯𝐚𝐧𝐜𝐞𝐝 𝐚𝐧𝐚𝐥𝐲𝐭𝐢𝐜𝐬. 𝐓𝐡𝐞𝐲 𝐧𝐞𝐞𝐝 𝐛𝐚𝐬𝐢𝐜 𝐯𝐢𝐬𝐢𝐛𝐢𝐥𝐢𝐭𝐲.
After working with many early-stage companies, I've noticed a consistent pattern.
The ones obsessing over predictive models and AI usually can't answer basic questions like:
- How many customers churned last month?
- What's our CAC when you include all costs?
- Which features are customers actually using?
- Which marketing channels actually drive revenue?
- How do conversion rates differ between customer segments?
Here's what I've learned:
1. 𝐋𝐚𝐠𝐠𝐢𝐧𝐠 𝐛𝐞𝐟𝐨𝐫𝐞 𝐥𝐞𝐚𝐝𝐢𝐧𝐠: You need to know WHAT is happening before you can predict what WILL happen
2. 𝐕𝐢𝐬𝐢𝐛𝐢𝐥𝐢𝐭𝐲 𝐛𝐞𝐟𝐨𝐫𝐞 𝐢𝐧𝐬𝐢𝐠𝐡𝐭: Can't optimize what you can't see
3. 𝐏𝐫𝐨𝐜𝐞𝐬𝐬 𝐛𝐞𝐟𝐨𝐫𝐞 𝐩𝐫𝐞𝐝𝐢𝐜𝐭𝐢𝐨𝐧: Bad process = bad data = worthless predictions
Of course, this feels unsexy. VCs ask about your AI strategy. Competitors talk about their predictive models. The pressure to be "cutting edge" is real.
But ultimately, I've seen companies raise funding with basic dashboards showing clean, reliable metrics. And I've seen companies with sophisticated data science teams fail because they built on shaky foundations.
We're in an interesting moment where AI tools are making advanced analytics accessible to everyone. But that doesn't change the fundamental truth - you can't skip the basics.
What's one basic metric you wish you could track reliably but can't?
1
59
Every data team has dealt with the pain of backend changes breaking downstream analytics
We throw lots of solutions at this problem - slack updates, alerts, data contracts, and other communication strategies
But every company I’ve ever worked with still feels some gap
That’s why I think the more lightweight, pragmatic tooling we have to bridge this, the better
Flowtasq is my own contribution to the space. It doesn’t completely solve the communication problem, but it does give engineers and analysts more visibility and control over the fallout
1
1
109
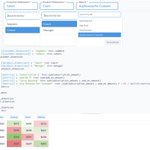
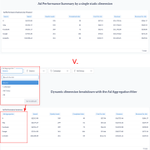
Ever find your Metabase dashboards too cluttered with slightly different variations of the same view?
Here’s how you can use SQL parameters to make questions more dynamic and de-clutter dashboards:
Instead of creating separate questions for every combination of dimension and metric, you can expose dropdown filters that let users choose what they want to analyze
This means:
✅ Fewer cards
✅ Less maintenance
✅ Cleaner dashboards
✅ More flexibility for end users
Plus, paying attention to everything often means paying attention to nothing. Rather than overwhelming people with a cluster of metrics, dynamic questions encourage focus - one view, one insight at a time
In the example below for a health coaching app, I created a pivot table that displays the user’s selected metric (Subscription $, Add-On $, Total Revenue, Avg Revenue Per Customer) across any combination of customer and product dimensions
One query, dozens of ways to slice the data
Feel free to reach out if you need help creating dynamic questions or simplifying your dashboards

3
119
Startups don’t need data specialists. They need operators who speak data
In big companies, there’s still room for data specialists. People who go deep on engineering, analytics, or science
But in most startups, that model doesn’t work. Why?
1. In early stages, there often isn’t enough work to justify a full-time specialist focused only on one part of the data lifecycle
2. Startups need ROI, fast. They can’t afford slow handoffs between five roles, or specialists who aren’t directly driving outcomes
One option is to hire fractional (and it seems many are moving in that direction)
The other option is to expand the data role to include ownership of operational outcomes
Of course that shift comes with challenges:
- Avoiding overload on a single person
- Finding talent with a broader skillset; a blend of technical skill and business thinking
The good news is modern tools (AI, no-code ELT, workflow automation) are making this crossover more possible than ever. They’re accelerating how quickly we can build, clean, and analyze data, and enabling specialists to own more of the data lifecycle and make real business impact
So I think we’re in the midst of the rise of a new kind of data role in startups:
Part analyst, part engineer, part operator, part product thinker
That means:
- Owning metrics and the processes that drive them
- Shipping pipelines, workflows, automations, reports, and dashboards
- Working with ops, product, and marketing as a true business stakeholder
If you’re at a startup and still trying to draw the line between “data” and “operations”, you’re probably already living this shift
And if you’re a data professional, it’s time to ask: can you crossover? Not just “here’s a dashboard”, but “here’s the metric, the lever that moves it, and the process I implemented to improve it”
Curious - are you seeing this trend and how are you navigating the blur between data and ops?
1
1
106
Similar to a product’s “aha” moment, there’s an “aha” moment with data
It’s the moment a non-technical person starts to recognize all the ways they can use data in their role
It’s also the moment someone starts coming to you with ideas for new reports, dashboards, and automations that would make them more efficient
One of my favorite parts about working with companies early in their data journey is seeing that flip switch
If you want a truly data-driven organization, your goal should be getting as many people as possible to that moment
Every successful founder I’ve worked with has been obsessed with cash flow
Not just at a high level but deeply involved in:
- What’s coming in and out
- Exact timing of payments
- Leveraging debt and credit
- Forecasting based on multiple scenarios
Being obsessed with cash flow means being obsessed with data
When founders spend that much time in spreadsheets, dashboards, and reports, it creates two things:
1. Opportunity for better, automated tooling
2. A culture where data isn’t just nice to have, but core to the business
And the more time founders spend in their numbers, the more it makes sense to automate the repetitive stuff
1
61
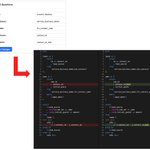
Just rolled out some major improvements to Flowtasq’s SQL parsing and column replacement functionality:
✅ More precise column replacement across a variety of tricky cases with table and column aliases, CTEs, and nested subqueries
✅ Better visibility into which questions Flowtasq can’t parse, so users know exactly where manual cleanup is needed
I’m building Flowtasq to save Metabase users time on tedious tasks like question edits and dashboard maintenance
If you’re still wasting time applying the same edits across lots of Metabase questions one-by-one, let’s chat!

1
1
59
A massive part of analytics is actually change management
Recently, I was discussing new initiatives with two clients who shared a similar sentiment:
“The team just got used to using X. Let’s hold off for a bit on any other big changes.”
It’s easy to forget:
- People have a natural resistance to change
- Developing new habits and routines takes time and reinforcement
- Business teams use data to support their day-to-day, not as their day-to-day
Shipping fast is great, as long as you’re balancing the introduction of new processes and tools with the right time and support for adoption
1
98
Healthcare automation companies talk about helping providers work “top-of-license”, freeing them from repetitive tasks so they can focus on what only they’re qualified to do
We should be applying the same principle to data teams
Data analysts shouldn’t spend hours:
- Fixing broken dashboards
- Copy-pasting logic across queries
- Hunting down schema-related errors
Our time is better spent:
- Understanding the business
- Testing assumptions
- Driving strategic decisions
That’s why I built Flowtasq - to help automate the boring parts of dashboard maintenance so analysts can focus on higher-leverage work
What’s taking up your time right now that shouldn’t be?
1
47
One of the most valuable things you can do as a data consultant is get more facetime with your clients
The best ideas don’t usually come from a requirements doc
They come from:
- “Wait…you’re doing it that way?”
- “We never actually use that report”
- “Honestly, this is easier if I just pull from X manually”
Opportunities come from being in the room
1
44
Under-appreciated dashboard idea:
“Lost opportunity” dashboards
They work wonders for motivating and holding your team accountable as the pain of loss > the pleasure of an equivalent gain (aka loss aversion)

1
30
I cut a multiple hours-long task into a few minutes
The other day on a client call, we discovered a duplicate field in the database across two different tables, and realized we’ve been using the deprecated one in all of our reports and dashboards in Metabase
Here’s why this seemingly insignificant detail is such a big deal for a data analyst:
Normally in Metabase, I’d have to
first find all the questions (aka queries or reports) using the field,
then update the field/logic in each individual question, one-by-one
In a Metabase instance with hundreds of questions, this can be super time-consuming. Not to mention extremely tedious and IMO a poor use of an analyst’s time
But with Flowtasq, these workflows take only a few minutes
I can search across all my Metabase questions for any instance of the field - either in the sql itself or in field filters
Then I can bulk update these questions, replacing the deprecated field once rather than individually in each question
Flowtasq is a tool I built to 10x my Metabase efficiency. Now I’m giving access to others to help you avoid the painful, non value-add tasks no data team should be spending time on
If you’re interested in getting access or seeing a demo, shoot me a DM
And if you’re wasting time on other manual workflows in Metabase, I’d love to see how I can help

1
1
90
My most productive client metric reviews end with more questions than answers
Which might seem counterintuitive…
…but if you already have all the answers, there’s not much of a need for data
Metric reviews are really an opportunity to find better questions
Better questions = progress
2
60
Four big metric mistakes I see business owners make:
1. Not tracking the right metrics
2. Not tracking metrics at the right time
3. Not tracking the right variation of a metric
4. Not tracking the right combination of metrics
Let’s drill into each:
1. Not tracking the right metrics
This one’s pretty straightforward
Track metrics that are meaningful and actionable for your business
For example, LTV is more meaningful for recurring rather than one-time services
2. Not tracking metrics at the right time
When you track certain metrics matters
Timing can change the meaning and usefulness of a metric
For example, company I worked with measured customer success team performance by time to implementation
Problem was, while their product and implementation processes were immature (no standardization between clients), this metric was essentially meaningless
Once they matured, this metric gave valuable insights into which implementation steps needed improvement and for which types of clients
3. Not tracking the right variation of a metric
How you calculate a metric matters
Calculating monthly lead to customer conversation rate as
total # customers in the month / total # leads in the month
is very different than
total # customers converted from leads in the month / total # leads in the month
4. Not tracking the right combination of metrics
Certain metrics lose meaning or actionability without the context of another metric
For example, tracking total revenue & revenue per customer paints a fuller picture than tracking one by itself
One way to think about metric pairs: growth metric + efficiency metric
1
2
40
Every text editor has “Find & Replace” functionality
Why doesn’t your BI tool?
For the past 3 years, I’ve built and managed Metabase instances for over 10 companies
This means creating lots of questions (queries) and dashboards, and keeping everything current as business needs evolve
Metabase is a great tool, but managing hundreds of questions can be super manual and tedious, especially at scale
Enter Flowtasq (link in comments) - my attempt to bring productivity tooling to the BI layer, starting with global search & replace
Whether it’s:
- A renamed table
- A broken filter
- A case statement you’ve used across 50 questions
You should be able to update it once and move on
BI deserves dev-level tooling too
If you’re a Metabase user and experience this struggle, I’d love to chat
2
2
175