

The intention is nothing but greatness!! • | Accountant | Tech 👨🏽💻 | Data Analyst 📊 | Web3 arc | Fortis Fortuna Adiuvat
The Moon
Joined May 2023
- Tweets34.4K
- Following3K
- Followers1.7K
- Likes24.5K


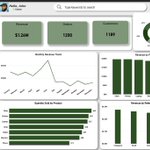
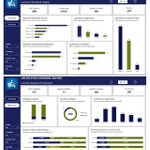
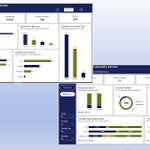


4 dashboards. One logistics story. 📊
Turning raw operational data into actionable insights across fleet, revenue, costs, safety and delivery.
#PowerBI


What can customer data tell us about online food ordering?
I explored this in my latest Power BI project, analysing customer demographics, ordering behavior, feedback, and experience.
Built with Power BI 📊


B I G J A Y 🥷 retweeted

THIS IS NO LONGER A FIGHT FOR ONE; IT IS A FIGHT FOR ALL.
Pending receipt of a substantive response from MTN Nigeria, my legal team @losensolicitors and I are currently collating information from MTN subscribers who have experienced unusual, unexplained, excessive or disputed

Dear @MTNNG , it is with a heart filled with joy I use to inform you that you have until 11:59pm Monday, 31st of August to duly respond to my comprehensive well broken down mail with a duly comprehensive report and review 🤝


B I G J A Y 🥷 retweeted

for nigerian women, it’s not just about wanting better but also how condescending they are to people on the same level as them or slightly above them.
a girl in 100 level will look you in the face and tell you she doesn’t like dating small boys. meanwhile, the ‘small boys’ she’s referring to are her coursemates.
“i saw a guy today, he was so clean and handsome, speaks so well. the only thing that spoilt his rep was that he was driving a corolla” - the words of a nail tech without bicycle.
ask a lady if she will marry a co-worker in the same department, she will tell you ‘no’. after she tells you no, tell her to state her reasons, you will understand this thread.


A dashboard can look good and still fail.
One thing I learnt in my data analytics journey is that building dashboards isn't just about knowing Power BI.
It's about knowing what to show, why it matters, and how easily people can understand it.
🤖 Made with AI

3. Context matters.
A KPI is more useful when you can compare it with a target, previous period, or trend.
4. Design is part of communication.
Good spacing, colours, hierarchy, and consistency can make data much easier to understand.
5. Build for the user, not yourself.
A dashboard should help someone make a decision, not just show that you know Power Bl.
#DataAnalytics
B I G J A Y 🥷 retweeted

I don’t know how this will sound, but if you can avoid spending over ₦1m on rent, please do.
Find a developing area and get a decent self contain or, at most, a room and parlour within ₦500k. You don’t have to prove anything by living in an expensive area.
And if you have a peaceful home and a family that can accommodate you, honestly, go back home for a while. Save aggressively, build your career, invest your money and become financially stronger.
There’s no shame in living with your parents while you’re building yourself. What matters is what you’re doing with the money you’re saving.
Don’t let rent consume a huge part of your income just because you want to maintain a certain lifestyle. Build first. Flex later. 😂

B I G J A Y 🥷 retweeted

And that’s why we keep saying, just because you have lost weight does not make you an expert or a health coach or a weight loss coach.
The knowledge is simply not there, breakfast is not the reason you were fat , excessive calories is the reason you were fat. You can eat 3 to 4 times and still lose weight.
A balanced breakfast of protein, fat, carbs is fine.
If you personally don’t function when you eat in the morning, that’s ok , that’s personal to you. Nutrition is a science and not a personal opinion.
Enough with all these.

• Which products generate the highest revenue?
• Which products sell the most units?
• Which referral source brings in the most revenue?
• What percentage of orders are delivered, pending, canceled, or returned?
• Are sales increasing or decreasing overtime?
#DataAnalytics
🤖 Made with AI

B I G J A Y 🥷 retweeted

He used to be different.
Avengers: Doomsday arrives in theaters everywhere December 18. Get your tickets now: fandango.com/AvengersDoomsd…