

Now find us on @sicbjournals.bsky.social . See our blog via https://xitter.cf/t.co/gF95H9can4, & find us now on Insta @iobjournal
- Tweets2.3K
- Following3.9K
- Followers1.9K
- Likes2.6K





ALT Fig. 2(A) A bone in a cantilevered loading regime, with a cross-section taken at mid-shaft to show the orientation of the loading and neutral axes. (B) Examples of measurements taken from the cross-sectional geometries include the CSA - cross-sectional area of the shaded region, C - centroid, R - distance to the furthest point from the minor axis, D - maximum Feret diameter. (C) Different cross-sectional shapes ranked from lowest to highest second moment of area. (D) Different cross-sectional shapes ranked from lowest to highest second moment of area when force is applied along the dorsoventral axis. (E) Example cross-sections found in nature (not to scale) - 1. Frog femur, 2. Gharial lower jaw, 3. Catfish pectoral spine, 4. Sea otter radius, 5. Chameleon humerus, 6. Bird femur, 7. Horn shark lower jaw, 8. Bat humerus, 9. Chipmunk humerus, 10. Gar fish body cavity, 11. Salamander humerus.


ALT https://tuckerheptinstall.weebly.com/photography-portfolio.html


ALT Fig. 1Overview of the different setups to calculate joint motion from kinematic data; using a (right) hindlimb example for a crocodylian in Maya software (Autodesk, San Rafael, CA). (A) Rigid body setup of marker-based XROMM, in which the bones are animated through the markers and joint motion is backcalculated from the relative orientation and position of its JCS and ACS (see Brainerd et al. 2010; Kambic et al. 2014; Knorlein et al. 2016; Manafzadeh 2020). ...


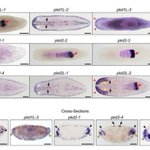
ALT Fig. 1Predicted domain structures of human and planarian PKD proteins and whole-mount in situ hybridizations of pkd genes in asexual Schmidtea mediterranea. (A) The protein domains of PKD1 and PKD2, human and planarian proteins, illustrate the conserved presence of key structural and functional domains in these proteins. REJ, receptor for egg jelly; GPCR, g-protein-coupled receptor; PLAT, polycystin-1, lipoxygenase, and alpha toxin; WSC, cell wall integrity and stress response component…


ALT https://lampichthys.com/ is where images are housed from Rene's Sunday fish sketch


ALT Fig 1Regions of the body and gills where samples were collected for denticle surface profilometry and size measurements. Outline of a white shark (Carcharodon carcharias) indicating where the five regions of tissue were sampled. AG = anterior to gill slit 1 (in green), LE = leading edge of interbranchial skin between gill slits 3 and 4 (in blue), TE = trailing edge of interbranchial skin between gill slits 3 and 4 (in orange), PG = posterior to gill slit 5 (in red), and B = body under the first dorsal fin (in gray).