
Analysis of and commentary on South African politics. Edited by: @GvanOnselen
South Africa
Joined February 2012
- Tweets548
- Following1
- Followers3.5K
- Likes2



Pinned Tweet
Hello all, welcome to the home of SA election data. I am going to treat this account like a live blog almost, talking about the data I have, how things are being developed and of course the outcomes. If you are interested in that kind of stuff, I would love to talk to you about it. Insights, thoughts, requests all welcome. All of the final data will appear on my blog - inside-politics.org - it already has a ton of stuff up on it, and I am always growing and developing it. So, if this kind of thing appeals to you, welcome!

At the risk of going down a JHB rabbit hole, at the expense of other metros, I have worked out the average change in the voters roll overall, for ANC-controlled VDs and DA controlled VDs, for the 2016, 2019, 2021, 2024 and 2026 registration weekends.
This was important to give some context to the 2026 numbers, which showed the Voters Roll in DA VDs grew by about 3x as much as it did in ANC VDs, after both registration weekends in 2026.
The graph below suggests, while the DA still dominates the ANC in terms of a ratio - which is great for the party - the raw number is low, far lower than 2016.
In 2016, the average DA VD grew by 142 voters, the average ANC VD by 72, for a ratio of 2:1.
In 2026, the average DA VD grew by 34 voters, the average ANC VD by 12, for a ratio of 2.8:1.
So the bottom line is, the DA's ratio is very promising for disproportional turnout, but voter enthusiasm in all markets, including the DA's is dropping. And while the DA's turnout differential looks like it will be strong, it's very likely going to be achieving that in a smaller pool of actual voters.

2021 only had one registration weekend, but my goodness was it bad for the ANC. Look at all that red (voters roll decline) in Soweto and surrounds. (This map only shows VDs in which the voters roll shrank in 2021).

1/3 Who won the registration battle in JHB?
Ok, so I am making my through the voters roll changes per VD in JHB over the two registration weekends. I have mapped them. Just to be clear though, changes in voters roll is one measure of registration success, but not the definitive measure. It is however the point of it all, and a good proxy for voter enthusiasm.
I have done one map for weekend 1, one for weekend 2 and one for both weekends combined.
Accompanying each map is a data table. These will be where the real insight lies.
I have worked out how the voters roll changed in VDs where the ANC is first, those where the DA is first and those where any other party is first.
This is also a good general proxy for enthusiasm or registration effectiveness for the two big parties.
But let me illustrate, here is the map for weekend 1.
The average growth of the voters roll across all VDs was 20.34. In other words the voters roll grew by an average of 20.34 voters per VD.
The average in ANC first VDs was 7.32.
The average in DA first VDs was 23.72
The average in other first VDs was 18.94
So, we can be pretty sure the DA out-registered the ANC by a ratio of around 3:1.
Others did well, not quite as well as the DA, but better than the ANC.

Here is the map for weekend 2. You can immediately see it is lighter than weekend 1, and so registration was generally weaker.
The overall average increase per VD was 10.32 - less than half weekend 1.
The ANC average was 4.34
The DA average was 10.41
The Other average was 9.47
So similar trends to weekend 1, just at lower levels. The DA ratio over the ANC was the same - around 3:1
In weekend 1, 542 VDs (63%) saw a growth in the voters roll; in weekend 2 - 530 (62%), so around the same number grew, just by smaller margins.

If we combine the two weekends, we get the following map.
The overall average change in the voters roll per VD was 30.66 (growth of 45,242 voters total)
The ANC’s overall average was 11.66
The DA’s overall average was 34.13
The Others overall average was 28.60
The long and the short of it is the DA dominated the ANC 3:1. Other parties did very well as a whole (although there likely some big fluctuations in there, party to party)
How well did the DA do? Sigh, I need to do the same calculations for previous elections, so we can compare its differential. 2016 in particular is an important comparator. I’ll get round to that as soon as I can. Other metros too!

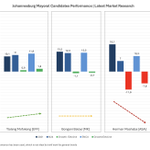
Let’s look at the N24/Sabi and ENCA/Markdata polls in JHB and see which “big party” mayoral candidate/party is running the most effective campaign. We will use the 2021 results in JHB as the benchmark against which to measure their performance.
• Helen Zille [DA]: 2021: 25.5% (N24: 29.2%, ENCA: 35.0%) - growth of 4pts to 10pts
• Tlaleng Mofokeng [EFF]: 2021: 10.1% (N24: 11%, ENCA: 11.9%) – growth of 1pt to 2pts
• Bongani Baloyi [MK]: 2021: Did not stand (N24: 12.3%, ENCA: 12.5%) – no baseline. MK got 13.2% in JHB in 2024, against which it would have a decline of around 1pt.
• Herman Mashaba [ASA]: 2021: 18.1% (N24: 7.0%, ENCA: 10.3%) - decline of 8pts to 12pts
• Dada Morero/ANC [ANC]: 2021: 33.2% (N24: 22.6%, ENCA: 21.8%) - decline of around 11pts
There is a graph setting all this out below.
The biggest problem here (apart from the ANC, but it seems to have given up and not even had a campaign or mayoral candidate, so there is little to analyse) is ASA. If these trends hold, it will have a disastrous campaign, in its stronghold.
Its strategic approach to it seems to have been to go intensely negative on the DA, and Helen Zile (she is Verwoerd, she will bring back apartheid, she is responsible for JHB’s condition) and on immigrants (they are responsible for JHB’s condition). As things stand, it seems to have backfired.
ASA continues to appear held hostage by the personal animosity its leaders have towards the DA. It has spent 3 months now, venting its spleen. The results are not encouraging. In this environment, where the ANC’s vote is fracturing left, right and center, it will be a dire result if it holds.
Still some small amount of time to improve those numbers, but you feel the party is unlikely to escape the trappings of its own emotional disposition in any meaningful way before election.
MK and the EFF are more of less stable, EFF shows some prospect of some small growth - but within margin of error.
DA looks set for a very successful election, but that might well be forgotten in the coming battle for coalition control and the mayoralty.

These are the 2026 provincial predictions that underpin that national result in previous tweet (with 2021 turnout in brackets for comparison).

I need to quite clear that this turnout model is an experiment. It has never been done before and, as a result, there are a lot blind judgment calls. The truth is, the actual 2026 turnout number is the final ingredient, to properly understand which modules worked, and which didn't and how to refine it all hopefully with a view to make it really good by 2029. That said, nothing ventured, nothing gained. This is the first estimate of the model, based on 7 modules, 4 elections and combined NPE+LGE results. I am going to keep testing it. Will keep you updated.

An update on the turnout model. I have finished four modules, each of which will feed into the final model.
Module 01 [urban/rural] - looks at the relationship between urban/rural VDs, new registrations and turnout
Module 02 [new registrations] - looks at relationship between new registrations alone and turnout
Module 03 [historic turnout] - looks at historic turnout patterns (particularly change between NPEs and LGEs]
Module 04 [political geography] - looks relationship between ANC-first, DA-first and Other-first VDs, new registrations and turnout.
Each of these modules have two baselines. One is a six election data set (2011, 2014, 2016, 2019, 2021 and 2024) and one is four election data set (2016, 2019, 2021, 2024). The benefit of the 6 election baseline is more data. The downside is older data sets impact result. The benefit of 4 election baseline is less data but the module far more attuned to recent trends.
These are not all the modules, there will be around eight of them in the end but, just for fun - I wouldn't rely on any one of these modules in and other itself, rather we have to see what they all produce together - I asked each completed module to make a 2026 turnout prediction: one using NPE results only, one using LGE results only and one using both NPE and LGE results. These are the outcomes:
Module 01 [urban/rural]
6 Year module [2011, 2014, 2016, 2019, 2021, 2024]
Historical calibration and predicted 2026 turnout
• NPE only: 38.31%
• LGE only: 45.20%
• NPE and LGE combined: 43.05%
4 Year module [2016, 2019, 2021, 2024]
Historical calibration and predicted 2026 turnout
• NPE only: 39.44%
• LGE only: 34.79%
• NPE and LGE combined: 40.18%
Module 02 [new registrations]
6 Year module [2011, 2014, 2016, 2019, 2021, 2024]
Historical calibration and predicted 2026 turnout
• NPE only: 37.84%
• LGE only: 45.53%
• NPE and LGE combined: 42.49%
4 Year module [2016, 2019, 2021, 2024]
Historical calibration and predicted 2026 turnout
• NPE only: 38.54%
• LGE only: 41.35%
• NPE and LGE combined: 40.37%
Module 03 [historic turnout]
6 Year module [2011, 2014, 2016, 2019, 2021, 2024]
Historical calibration and predicted 2026 turnout
• NPE only: 39.43%
• LGE only: 45.26%
• NPE and LGE combined: 41.96%
4 Year module [2016, 2019, 2021, 2024]
Historical calibration and predicted 2026 turnout
• NPE only: 37.49%
• LGE only: 32.87%
• NPE and LGE combined: 36.34%
Module 04 [political geography]
6 Year module [2011, 2014, 2016, 2019, 2021, 2024]
Historical calibration and predicted 2026 turnout
• NPE only: 38.24%
• LGE only: 44.59%
• NPE and LGE combined: 42.42%
4 Year module [2016, 2019, 2021, 2024]
Historical calibration and predicted 2026 turnout
• NPE only: 36.64%
• LGE only: 39.82%
• NPE and LGE combined: 39.82%
Am trying to build a model to predict turnout. I feel I am getting closer, but it is very difficult. On version 58 now. Essentially it was initially designed to use changes in the voters roll over registration weekends. It was solid (out by a few points on most elections). But 2021 is proving a very year to get right, and that means the others - even though they appeared rightish, weren’t. So I have moved onto a more complex model, that sits outside the data. It will work on a range of variables, including urban/rural divide, population group, all registration activity, previous turnout levels and party support. You can in theory then feed in the 2026 data, and see what it says. These are a lot a variables to build and identify meaningful predictive relationships with. And I’m not sure if it will work, but we shall see. It would be such a game changer if you could get an accurate forecast of turnout. I really do feel it is possible. Interestingly, one of the strongest predictive variables so far is actually new registrations. Two weeks to get this right, if possible at all.
1/4 A preliminary look at the 2026 voter registration weekends. Did the ANC do better than expected?
I am working with registration data at the moment. Thanks to a wonderfully patient and helpful person at the IEC, I have the actual changes in the voters roll before and after each registration weekend down to VD level, for 2026, 2024, 2021, 2019, 2016, 2014 and 2011. This is a fantastic data set.
It is not the definitive measure of registration activity - a change in registration details for example can hide in the data - but it is the definitive measure of the core outcome: to what degree does the voters roll grow or shrink after each registration weekend, and where does this happen.
Here are the core figure for 2026 and accompanying maps (blank = no change, green to dark green = increase; red to dark red = decline).
Let’s start with the first weekend:
First weekend: Net increase: +450,457


So, the first and most obvious thing to notice is weekend 1 (which accounted for 63.31% of all voters roll growth) was much more successful than weekend 2 (36.69%). Almost twice as successful.
Weekend 1 increased the voters roll by 1.61%; weekend 2 by 0.93%, for a net growth of 2.54%.
This is not great - I have looked at all the other years and will set them out at some point but by way of immediate comparison, 2021, a disaster year for registration and turnout, the roll grew by only 2.03% (although there was only one weekend back then).
In 2016 - a bumper year for registration and turnout - the net increase across both weekends was 5.18%.
There is a ton of stuff we can do with data - for one, look at registration changes against majority ANC and DA VDs.
Also look at metro levels.
For the moment, let me leave you with one counterintuitive observation, if you use the IEC classification of urban and rural VDs, in 2026 the voters roll grew on average by 1.82% in urban VDs, but by 3.90% in rural VDs.
Because urban VDs tend to be more populous than rural VDs that is an actual raw number increase of 325,763 (urban) vs 393,055 (rural). Nevertheless, given rural VDs the ANC strongholds, it suggests the ANC had a stronger registration campaign than one might first think.
This will require more digging to be definitive about, but those base figures pretty remarkable.
Some thoughts on ASA’s position on coalitions
ASA made a decision early on - and I think it was the right decision - that it would position itself as a party of government, not opposition.
Outside power any small party risks irrelevance.
To maintain that brand, it formed a coalition with the ANC in Tshwane to give it the mayorship. That, really, was all that coalition was about. ASA is a minority partner in that coalition, but wields disproportionate influence with the mayorship.
There are upsides and downsides to this. The upside is relevance, the downside is discontent among opposition voters - by removing the DA to achieve that. ASA is banking on the former outweighing the latter.
There is some strong evidence the decision has done both things - ASA looks set to grow marginally in Tshwane, but then so goes the DA.
Meanwhile, down the road, interim leader Herman Mashaba’s campaign is not delivering, if current market research is accurate.
That is a brand problem - it is rare in politics for your leader to be outperformed on the favourability front.
And Mashaba is ASA’s core brand.
In Ekhuruleni, ASA has the least momentum, it might grow marginally as well, but its base support there is lowest of three metros.
In other metros, ASA will be very small.
So, the problem ASA faces is that, while it will most definitely be a factor when it comes to coalition negotiations, TSH will be its strongest card, followed by JHB (this analysis excludes “luck of the layout” scenarios - where ASA is the kingmaker with a tiny percent, one can’t forecast those situations, you either get them or you don’t).
If ASA’s strategy remains relevance, through power, you can be pretty sure it will take any offer it can, from any party, to return it to power.
And given its downward trend in JHB, and upward trend in TSH, capitalising on that shift will be paramount. If it does go into opposition in Tshwane, it risks lose any momentum it has generated.
ASA has been very careful not to rule out any party in its preconditions for a coalition - a set of three commitments that are so vague any and all parties meet them.
To cut a long story short: the scenes is set for ASA to do whatever it takes to get back into power in Tshwane. I suspect it would work with the EFF and MK if it offered the party what it needs to maintain its strategy.
It is, in many senses, the most desperate of all parties. Its whole approach risks falling apart unless it can get into a government.
Other parties - the ANC and DA in particular - will also be hyper-focused on getting into government, but they do have the luxury of other governments, to demonstrate relevance.
The defining thing for ASA will be the mayoralty. That is the real reason it is so hostile to the DA. It can cut that kind of deal with the ANC, EFF and MK, three also desperate parties. It cannot with the DA. The DA will insist on the mayoralty. And ASA has seen how powerful that is in TSH.
So, I suspect ASA in Tshwane is going to be a nightmare post November, an absolutely desperate organisation, that will do anything to form a government with it as the mayor. JHB too, but that will probably have more to do with Mashaba’s ego than anything else. TSH is the metro where it is actually growing, capitalising on that is going to produce self-interest the likes of which you have never seen before.
Watch this space.
1/7 What shape is the DA’s turnout egg in?
I have done the exact same analysis for the DA, that I did for the ANC (see previous thread for all the explanations). Let’s see what shape the DA’s egg is in. First the raw data, here are all metro VD’s for each LGE, plotted against turnout (vertical axis) and DA support in that VD (from left to right, 0% to 100%).
The first thing to notice is that the general shape of the “swarm” of dots is different, sloping up and towards the top right (which is exactly where you want to be as a party: high turnout and high party support).
The ANC’s swarm more resembled a banana. So, you can already tell, in general terms, DA turnout is in a healthier position.
Let’s look at the individual elections one at a time.

Alas, things fell apart in 2021. A dramatic drop in turnout meant that the egg fell down, significantly to the left, flatter and now tilted again.
While the DA did exceptionally well relative to the lower turnout average - 88% of all DA 50% VDs fell above the average, 100 VDs fell out of the bubble and the drop and movement to the left, meant that those that did not fall out were with less - lower turnout, lower support.

It is going to be incredibly hard for the DA to lift its egg in 2026, as general turnout seems set to decline again, but there is a good chance it can shift its egg back to the right, which is most important. Needs to urgently arrest that sideways movement.
Its egg in 2021 was also starting to get a little bit squashed, which is bad. One needs vertical spread.
As with the ANC, here is the raw data again, will all of the DA’s trend lines, one per election.
