

Vibe trader & learning quant trading @nansen_ai affiliate
Joined November 2024
- Tweets7.3K
- Following747
- Followers5.6K
- Likes12.7K


Pinned Tweet
Talking about the end of the bear market
It’s also worth considering this possibility
$ETH, ETH/BTC, OTHERS.D, BTC/SPX charts are attached
ETH + ETH/BTC: The trend reversal has begun, as seen on the chart, but there’s a small chance we’ll see one more leg of the trend, however, it’s already worth starting to make spot purchases
This is either the LAST or the second-to-last chance to catch the bottom
OTHERS.D: In short, there will be an alt season; the question is in which sector.
They’ve shown strength (SMT) against $BTC, so you can bet on that here as well (I’ll elaborate on this later)
BTC/SPX is in a zone where capital will flow into $BTC (the SPX has been dominant, but now BTC will have more freedom to move)
If we assume that the SPX will either hit a new high or remain within the same range, then $BTC is poised for new highs
It’s a very promising picture, though the timing is a bit uncertain, but it’s worth keeping this scenario in mind
Again, this isn’t about the specific values I’m charting, it’s purely about the direction and approximate timing (trust me, when it comes to investing, that’s all you need)


I will just leave these charts here
And will come back to them in some months
IWM/BTC, $IWM, $BTC, IWM/SPX
IWM/BTC, to gauge capital flows into crypto (just look at how perfectly this chart illustrates outperformance, underperformance, and trend reversals in crypto)
IWM/SPX, to gauge whether the stock market is overheated - that is, the low-cap index relative to the high-cap index
This isn't about specific values, but about fundamentals and timing, I'm not going to speculate on the numbers
But it's worth noting that momentum has started to slow on $BTC, so the end will come quite soon


insaino retweeted
$NVDA +4% $AMD +3% $SMH +2.8%
most traders see three bullish trades
a better trader sees one trade repeated three times.
that's the problem with trading tickers instead of exposures.
if semis are moving together, buying all three
doesn't give you three independent bets.
it gives you more of the same risk.
the interesting setup appears when one breaks away.
$SMH +2.5%
$NVDA +3.1%
$AVGO +2.7%
$AMD -1.4%
now $AMD is the trade worth investigating.
not because -1.4% is a huge move.
because it's abnormal relative to the basket.
you can structure that several ways:
mean reversion → long $AMD / short $SMH
continuation → short if relative weakness persists
options → trade abnormal IV expansion
pairs → hedge market + semiconductor beta
now you're not betting that tech goes up.
you're betting that the divergence itself
contains information.
that's a much cleaner trade.
the market gives you thousands of price moves every day.
most are just shared risk moving around.
the setups worth trading often begin
where correlation suddenly stops working.
try and build your own strategy: join.horizon.trade/app
insaino retweeted
$TSLA can drop 8% and give you zero edge.
then drop 2.7% the next week and print one of the cleanest setups on your screen.
because traders obsess over absolute moves.
the market trades relative moves.
say $TSLA dumps 8%.
but:
$QQQ -4.1%
$ARKK -6.2%
VIX +22%
high-beta tech selling everywhere
there's nothing particularly weird here.
now $TSLA falls just 2.7% on another day.
$QQQ +0.6%
$ARKK +1.1%
$NVDA +1.8%
volume 2.4x average
that's the move worth watching.
something is happening that beta can't explain.
and now you have multiple ways to trade it:
continuation → short abnormal weakness
mean reversion → fade a >2σ residual
pairs → long peers / short $TSLA
options → trade the volatility repricing
the biggest candle gets attention.
the unexplained candle gets capital.
insaino retweeted
$NVDA can rally 6% and still have no trade.
$SPY can move 0.8% and create a better setup.
because the size of the move isn't what matters.
the abnormality is.
imagine $NVDA opens +5%.
looks like an obvious momentum trade.
then you check:
$QQQ +2.1%
$SMH +3.8%
$AMD +4.4%
semis broadly bid
suddenly that +5% isn't special.
you're chasing a move the entire sector already explains.
now flip it. $NVDA +3.2%.
but:
$QQQ +0.3%
$SMH +0.5%
$AMD flat
volume 2.4x normal
that's a much more interesting trade.
something stock-specific is happening.
same logic works for mean reversion.
if $TSLA dumps -7% while $QQQ is -4%,
you're partly trading the market.
if $TSLA dumps -7% on a flat index
with no comparable move in its peers,
the setup has a very different distribution.
this is why good trading starts with context.
index → what is the market doing?
sector → are peers confirming?
volume → is real flow behind it?
volatility → is the move actually unusual?
residual → what's left unexplained?
don't trade the biggest candle.
trade the move that looks wrong
relative to everything around it.
insaino retweeted
50 stocks can still be 1 trade
- that's the diversification problem most traders never measure
you can own:
$NVDA $AMD $AVGO $META $MSFT $QQQ
and think you have six different ideas.
statistically, you may just be long the same underlying factor six times.
that's why quants decompose returns.
stock return = market β + factors + residual
PCA takes this further.
feed it hundreds of correlated assets and it
compresses them into the few common components actually driving covariance.
suddenly 500 tickers become something closer to:
market
sectors
momentum
rates
volatility
residual noise
now the research gets cleaner.
if $AMD rallies +5%, but semis explain +3%, market beta explains +1% and momentum explains another +0.6%...
the interesting move is the remaining +0.4%.
that's what you test.
is the residual at +2σ?
does it historically mean-revert?
does the effect survive OOS?
does it still exist after slippage + fees?
this is why quant trading feels backwards.
you don't start by finding more signals.
you start by explaining away as much of the return as possible.
whatever survives the subtraction
is where alpha might actually be hiding.
insaino retweeted
$NVDA +4% doesn't mean you found a trade
after removing beta, sector and momentum, the real move might be +0.6%
that's how quants look at markets
not: what moved?
but: what part of the move shouldn't have happened?
take 500 stocks.
they look like 500 independent opportunities.
PCA might show that a handful of common factors explain most of their covariance.
market beta > remove it
sector exposure > remove it
momentum/value > remove it
residual > now measure the anomaly
this is where stat arb starts getting interesting.
say $NVDA's residual reaches +2.4 sigma while semis, $QQQ and momentum factors remain normal.
the trade isn't "NVDA looks expensive."
the hypothesis is that the idiosyncratic move is statistically stretched relative to its own distribution.
then you try to kill it.
does +2 sigma mean-revert OOS?
does +2.2 sigma also work?
what happens after costs?
does it survive high-vol regimes?
how many independent observations exist?
because a clean backtest can still be noise.
and 100 correlated trades can still be one bet.
that's the real quant workflow:
decompose > isolate > test > reject > size
retail trades the move.
quants trade what's left after explaining it.
insaino retweeted
1,000 random strategies can produce a Sharpe 2 winner.
no alpha required.
that's why the most dangerous quant strategy
is often the one with the cleanest backtest.
say you test:
$SPY: 20D mean reversion
$QQQ: overnight momentum
$NVDA: post-earnings drift
$TSLA: volatility breakout
$BTC: 4H trend following
then vary 10 entry thresholds,
5 holding periods and 4 vol filters.
that's 200 versions per strategy.
1,000 backtests total.
at p < 0.05, some strategies can look
statistically significant purely by chance.
and the winner can look extremely real:
: $NVDA LONG
breakout: 20D high
hold: 5 days
win rate: 61%
Sharpe: 2.3
now change 20D → 19D.
Sharpe drops to 1.1.
change 20D → 21D.
Sharpe drops to 0.7.
that's not robustness.
that's a parameter lottery.
a real quant process tries to kill the trade:
OOS > does it survive unseen data?
costs > does EV survive slippage?
perturbation > do nearby parameters work?
regimes > does it survive bull + bear?
attribution > is this alpha or just $QQQ beta?
because 100 trades in tech
aren't necessarily 100 independent bets.
they might be one factor exposure
repeated across 100 tickers.
the cleanest test comes after the backtest:
-freeze the parameters.
-timestamp the strategy.
-trade the next 100 signals unchanged.
- the past can always be optimized.
the next 100 trades can't.
that's the real quant game.
not finding a strategy that makes money.
building a filter where randomness
has a very hard time pretending to be alpha.
insaino retweeted
1,000 random strategies can produce a quant that looks like a genius.
no alpha required.
that's the uncomfortable math behind backtesting.
at a 5% significance threshold:
1 test > one hypothesis
100 tests > ~5 false positives
10,000 tests > a lot of convincing noise
the computer isn't necessarily finding alpha.
it may just be searching long enough
for randomness to produce a clean equity curve.
and sample size can be misleading too.
- 10 years of trades doesn't automatically mean
- 10 years of independent evidence.
- 100 tech stocks can still be one factor bet.
observations != independent observations
profit != evidence
Sharpe != proof
that's why real quant research is mostly filtration.
statistical strength > is the effect above noise?
OOS > does it survive unseen data?
robustness > do nearby parameters still work?
mechanism > why should the edge exist?
a real effect shouldn't disappear because
20 days became 19 or 21.
the cleanest test is even simpler:
stop changing the strategy.
timestamp the rules.
then let new data attack them.
because the future has one advantage your backtest will never have:
you can't optimize it after seeing the answer.
the job of a quant isn't finding a strategy that makes money.
it's building a test
that randomness has a hard time passing.
insaino retweeted
5 equations can matter more to a quant fund than 500 forecasts.
none of them predict the next candle.
they answer a harder question:
how much of your backtested edge actually survives reality?
Kelly > how much should you bet?
impact > what does size actually cost?
capacity > where does the edge disappear?
multiple testing > was the Sharpe just luck?
log growth > what return do you actually keep?
the interesting part is how these equations interact.
market impact scales roughly with √(Q/V).
so increasing size doesn't just increase PnL.
it increases the cost of extracting that PnL.
eventually:
expected edge = market impact
that's your strategy's capacity.
past that point, more capital can make
a profitable strategy less profitable.
and research has the same hidden ceiling.
test enough parameters and eventually
noise produces a beautiful Sharpe by accident.
the source gives the sharp example:
45 variants > Sharpe ~1 can appear from zero edge
then variance takes another cut.
because your account compounds geometrically,
not at the arithmetic average return.
that's the part most traders miss.
the signal tells you where the edge might be.
quant math tells you whether you can size it,
execute it, scale it and actually keep it.

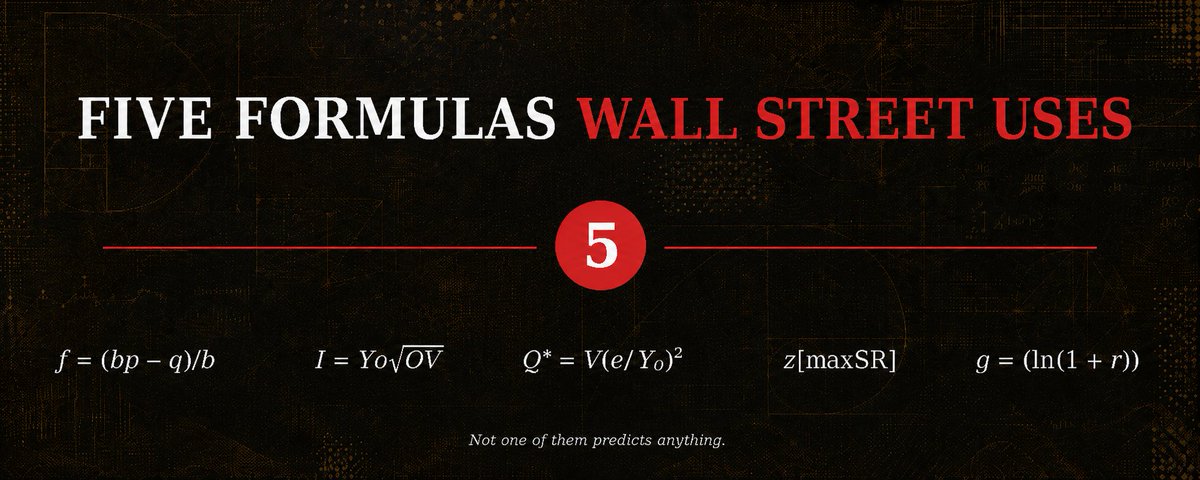
5 equations can matter more to a quant fund than 500 forecasts.
none of them predict the next candle.
they answer a harder question:
how much of your backtested edge actually survives reality?
Kelly > how much should you bet?
impact > what does size actually cost?
capacity > where does the edge disappear?
multiple testing > was the Sharpe just luck?
log growth > what return do you actually keep?
the interesting part is how these equations interact.
market impact scales roughly with √(Q/V).
so increasing size doesn't just increase PnL.
it increases the cost of extracting that PnL.
eventually:
expected edge = market impact
that's your strategy's capacity.
past that point, more capital can make
a profitable strategy less profitable.
and research has the same hidden ceiling.
test enough parameters and eventually
noise produces a beautiful Sharpe by accident.
the source gives the sharp example:
45 variants > Sharpe ~1 can appear from zero edge
then variance takes another cut.
because your account compounds geometrically,
not at the arithmetic average return.
that's the part most traders miss.
the signal tells you where the edge might be.
quant math tells you whether you can size it,
execute it, scale it and actually keep it.
insaino retweeted
1,000 backtests can produce ~50 “significant” strategies
even when every single strategy is noise.
that's the problem with AI quant research
AI can now generate hypotheses faster than
your statistics can reject them.
at p < 0.05, roughly 5% of random tests
can pass the threshold by chance.
10 trials > noise is manageable
100 trials > false discoveries accumulate
1,000 trials > ~50 can look significant
and they'll come with clean equity curves,
good Sharpe and convincing explanations.
so the important agent isn't the generator.
it's the validator.
t-stat > 3 > raise the evidence bar
n >= 100 > reject tiny samples
OOS/IS >= 0.5 > measure overfit decay
profitable folds >= 60% >= test consistency
costs > subtract fees + slippage first
corr < 0.5 > reject duplicate exposure
then log every hypothesis you tested.
because a Sharpe 2 strategy found on trial #4
isn't statistically equivalent to one found on #400.
the architecture becomes:
scanner > hypothesis > backtest
validator > holdout > paper > deploy
most strategies should die before the holdout.
that's not wasted research.
that's the system correctly separating
a statistical edge from a lucky sample.
Test any strategy here:
> join.horizon.trade/app