unknownIndian (@indi101) profile picture

Various interests

United States
Joined January 2018
Photo by unknownIndian (@indi101)Photo by unknownIndian (@indi101)Photo by unknownIndian (@indi101)Photo by unknownIndian (@indi101)Photo by unknownIndian (@indi101)Photo by unknownIndian (@indi101)Photo by unknownIndian (@indi101)Photo by unknownIndian (@indi101)Photo by unknownIndian (@indi101)Photo by unknownIndian (@indi101)
Forecasting is hard work!
Seems like the descent has started.
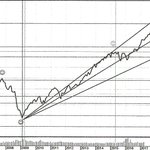
Todays Date: 8/18/20: Final Word on the Market: Topping in Progress. S&P 500 to descend to 1500 by March 2021
Topping process still in progress.
Well, we are almost there. Prepare for the topping process and then the descent.
Just to clarify for those who accidentally read my tweets: The figures I quote are based on monthly charts. ie. The first market working day of the month. And it is the End of day figure.
After sp500 index hits bottom at 1500 the new top will be 3500.
S&P Bottom at 1500.
S&P 500 bottom at 1500 or 1200. approximate time: 1 to 1 1/2 years.
Economic growth collapses. Feds and monetary policy/stimulus have become irrelevant.
And all this within two years from now. During this time there are no safe assets. Keep everything in cash/money market fund.
50% to 65% drop of the SP500 has begun.
Well, we are almost there. Prepare for the topping process and then the descent.
Replying to @indi101
The Top for sp500 is 3180. Another 18% climb from today
Next support at 2800
The stocks are moving in the following range: 2900 - 2950. The 2900 support was not broken today ((EOD) reading). If this support breaks then further downside.
The last resistance is at 2950. Once this is broken S&P500 shoots up to 3180.
S&P 500 to climb to 3180 (another 9.5%). Descent starts middle of the next year. Index to loose 55% to 60% of its value. Goldman's Bear Market Indicator Shows Crash Dead Ahead, Asks "Should We Be Worried?" | Zero Hedge zerohedge.com/news/2018-09-0…
Aug 31 st, 2018: Reached 2900
Replying to @indi101
The Top for sp500 is 3180. Another 18% climb from today
Replying to @indi101
The Feds Fund rate between 2.5% to 3% will signal the topping of SP500. Start taking precautions at 2.5%
The SP500 on a longer scale has been in a Bull market. But on a shorter scale from Feb 2018 till today it has been in a bear market. Today it broke through and is in a bull market. Good news for stocks. xitter.cf/indi101/status/1004190…
Level 2700 was broken but now reinstated. Everything as before in the chart. xitter.cf/indi101/status/9697082…