

Finding frontier tech signals: AI, chips, energy, biotech & crypto. Tech stocks, small caps, supply-chain analysis. EN / 日本語 / 中文.
Joined May 2018
- Tweets1.1K
- Following20
- Followers1.1K
- Likes87
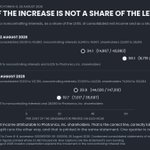


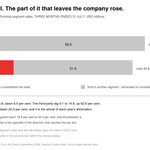


Photronics' release headlines USD 28.9m against 22.9m a year ago. That is net income attributable to Photronics shareholders, correctly labelled, in both periods.
The consolidated row above it went 29.1m to 43.9m. The whole distance between the two is one printed row: net income attributable to noncontrolling interests, 6.2m to 15.0m.
So of the quarter's 14.7m increase in consolidated net income, 8.7m is the minority's. That is 59 per cent of the increase, against 34 per cent of the consolidated level.
Nine months runs the other way: 20 per cent of a 35.7m increase, and the minority's share of the consolidated level fell, 33.2 to 29.9 per cent. A single quarter is not a trend.
Neither the release nor the deck says why. $PLAB

Donaldson prints a reported and a constant currency growth rate for each of nine lines, in two windows: the three months and the twelve months to 31 July.
Divide one base by the other. Over the twelve months the ratio is positive on all nine lines. In the fourth quarter it is negative on three, positive on three, and inside the rounding band on three.
For the company as a whole the ratio is at least four times smaller in the quarter than across the year.
Two percentages do not subtract: 1.053 / 1.034 = 1.0184. Not 5.3 minus 3.4.
The release states no method for that basis. This is one company's own two printed numbers read against each other, and it says nothing about any currency.

$BNED reported its fiscal first quarter on 8 September. The release pairs two improvements, and the distance between them is the part worth reading.
Net loss improved 5,357, from -18,271 to -12,914. That is the 29 per cent in the headline. Adjusted EBITDA improved 2,173, from -11,494 to -9,321, which is the 19 per cent.
The 3,184 between the two is 59.4 per cent of the GAAP improvement, and it is exactly the five reconciling lines:
Depreciation and amortisation -1,034
Interest expense, net -1,027
Income tax benefit +1,578
Other income, net -1,249
Stock-based compensation -1,452
Four steps run one way and one runs the other, from two different causes. Three add-backs are simply smaller than a year ago. Other income is not: its subtraction grew, -49 to -1,298. And the income tax line is a BENEFIT, so it subtracts in a list the company's own definition calls plus - a smaller benefit subtracts less, which is why it is the only positive step.
Both bridges foot to the printed adjusted EBITDA exactly. USD thousands.

I used #GPT6 to run a complete simulation of a Taiwan Strait war involving China, the U.S., and Taiwan—a full sandbox wargame covering air, naval, space, and ground forces.
You won’t believe how it ends.
$INNV reported its fiscal year to 30 June last night. The line worth pulling out only appears when you divide by member months instead of reading the totals.
Member months rose 7.8 per cent, to approximately 96,050 from 89,130. Per member month:
Revenue 9,578 to 10,304, up 7.6 per cent.
External provider costs 4,837 to 4,683, DOWN 3.2 per cent.
Cost of care, excluding depreciation, 3,017 to 3,249, up 7.7 per cent.
Centre-level contribution margin 1,724 to 2,371, up 37.6 per cent.
The two care lines moved in opposite directions, and the fall is a per-unit result rather than a total. In absolute terms external provider costs ROSE, 431.2m to 449.8m, up 4.3 per cent. Volume growth of 7.8 per cent is what flips that sign.
Revenue less the two cost lines equals the printed contribution margin exactly in both years. Member months are given as approximate, so every per-unit figure above is approximate too. USD throughout.

Mission Produce reported its fiscal third quarter last night. The International Farming segment is a lesson in reading a segment table.
Segment sales fell, 49.0 to 45.8, down 6.5 per cent. But that total holds two different things. The part sold to third parties went 9.1 to 14.8, up 62.6 per cent. The part sold to another Mission segment went 39.9 to 31.0, down 22.3 per cent - and that affiliated leg is the whole of each year's consolidation elimination.
So the segment total falls while the only part of it that reaches consolidated net sales rises by nearly two thirds. Third-party share of the segment: 18.6 per cent to 32.3 per cent.
Both years close exactly - the four segment totals less the elimination give net sales of 450.0 and 357.7. USD millions, $AVO.
The release says affiliated sales concentrate in the second half with the Peruvian harvest, so one quarter is not a trend. But a segment total moving opposite to its own external leg is worth knowing before you read a direction off it.

Group 1 Automotive's twelve months to 30 June 2026, off one table.
Share of revenue, 22,154.7 million: new vehicle retail 48.5%, used retail 32.0%, used wholesale 2.7%, parts and service 12.8%, finance and insurance 4.1%.
Share of gross profit, 3,532.5 million: new retail 20.2%, used retail 9.3%, parts and service 45.0%, finance and insurance 25.6%. Used wholesale is negative.
The three vehicle lines are 83.1% of revenue and 29.4% of gross profit. Parts and service plus finance and insurance are 16.9% of revenue and 70.6% of gross profit.
Used wholesale is the one line whose printed cost exceeds its printed revenue, 592.9 against 595.0. Finance and insurance is reported net, so its revenue and its gross profit are the same figure. $GPI

Nabors Industries' 2026 outlook prints three ranges. Capital expenditures 920 to 930. Adjusted EBITDA 710 to 730. Adjusted free cash flow 20 to 30. USD millions.
Take the lowest capital spending against the highest adjusted EBITDA and the first is still the larger, by 190. Take the other corner and it is larger by 220. There is no pair inside the two ranges that reverses it.
Adjusted free cash flow is 2.7% to 4.2% of adjusted EBITDA at the corners.
The deck states it does not provide a forward-looking reconciliation of these measures, so nothing here bridges them. $NBR

EVI Industries closed its June year with revenues up 14.6%, gross profit up 18.9%, operating income up 14.1% and net income up 2.9%. Diluted earnings per share went 0.49 to 0.48.
Every line rose except the one per share.
The two printed per-share figures round from bands that do not overlap, so the fall is not a rounding artefact: 0.48 sits below 0.485 and 0.49 sits at or above it. With net income up 2.9% and the per-share figure down, the diluted count rose by more than net income did.
Those bands put the implied count between 15,148 and 15,460 in 2025 and between 15,913 and 16,248 in 2026, a rise of between 2.9% and 7.3%. The release does not print the count. $EVI

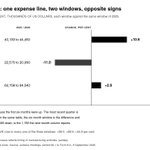
Read enGene Holdings' research line over the quarter and it is down 11.0%. Read it over nine months and it is up 2.8%. Same line, same table, opposite signs.
Third quarter: 22,575 to 20,090, thousands of US dollars. Nine months: 62,758 to 64,540. So the first six months, which is the difference between the two printed columns, went 40,183 to 44,450, up 10.6%.
It closes exactly: 4,267 up then 2,485 down is the 1,782 the nine-month column reports.
General and administrative rose in all three windows: +38.0, +88.9, +55.9.
The release attributes the research decrease to timing of manufacturing activities, partially offset by workforce reduction-related costs. $ENGN

ABM Industries' group segment margin moved 7.66% to 7.69% in the July quarter. Not one of its five segments moved by that little.
Ordered by revenue growth, with the change in segment operating margin:
Business and Industry -2.6%, +0.30 points
Education +0.3%, +0.78
Technical Solutions +4.2%, +0.50
Aviation +12.4%, -1.14
Manufacturing and Distribution +17.6%, -0.48
The three slowest lines all widened. Both fast ones narrowed. Aviation is the only segment where revenue rose and operating profit fell outright: 291.8 to 328.1 million against 19.7 to 18.4. $ABM

UNFI's FY2026 release reconciles free cash flow as operating cash flow less payments for capital expenditures. 540 minus 217 is 323 this year; 470 minus 231 was 239 last year.
A separate table in the same release adds cloud technology implementation expenditures to capex and names the sum: 217 plus 35 is 252, against 231 plus 7 a year ago.
So one of the two components is deducted and the other is not - and the one that is not rose fivefold, from 7 to 35, while capex fell 14.
Deduct both and free cash flow is 288 against 232. A rise of 56, not 84. The 28 difference is exactly the increase in the cloud line, and it is one third of the reported improvement.
The release discloses both figures itself and guides the combined measure to about 300 next year. No reason is offered for either change and none is inferred here.
