

All-in-one Trading Platform. 100+ indicators • Real-time Charts • Scanning • Founders of Liquidation Heatmap • Reports • Backtesting •More!
Joined October 2019
- Tweets3.1K
- Following656
- Followers40.8K
- Likes1.6K




Hyblock retweeted

What's Driving This Sunday Pump? 👀
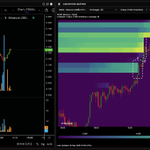
A liquidity cluster was sitting just above Bitcoin's price earlier today.
Looks like some traders spotted the opportunity and built a bid wall to support the move.
The spot Bid/Ask Ratio (0%–1%) jumped to 0.3, signaling stronger buying pressure.


New: Select All tickers (1000+) on every widget.
One click fills a Screener, Spaghetti chart, RankMap, or other multi-coin widget. Thousands of coins in the same view, updating fast.
youtu.be/8HcG89-3a08
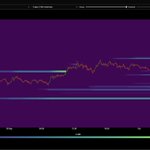
$SOL liq heatmap.
lot of data providers out there trying to sell you liq heatmaps. all of them are trying to do the same thing: predict real liquidations.
the difference between us and the rest is we show this consistently in real-time, at the lowest granularity (1min, 5min etc.):
liqs predicted => liqs triggered.

the quality of your agents/trading assistance depends on the quality of the underlying data.
give your agents quality liq heatmaps, not some randomness: hyblockcapital.com/api

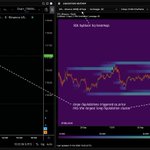
NEAR: significant large liquidation events triggered on the exact price clusters predicted in advanced by the hyblock liq heatmap.
A, B, C show all three events, at the exact candle.
Liqs predicted => liqs triggered.

Hyblock retweeted

$BTC Sunday update:
Bullish case is in play - retracing the LP that reaches up to $89.3k. It'd make sense to fully retrace it.
Personally, I was supporting more the bearish case last week but I was mindful and also ready for this trade as I explained.
What's next?
🧵↓(1/5)


As soon as $XRP price hit the largest liquidation cluster, we saw a large liquidations occur at the same exact 5minute candle.
hyblock liquidation heatmaps predict real liquidations, at the most granular level.
liqs predicted => liqs triggered.

ALT Hyblock Liquidation Heatmap: Accurately predicting real liquidations when the largest predicted liquidation cluster is hit. At the exact 5minute candle.
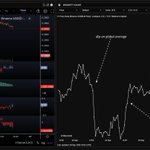
To find relative strength among tickers, de-select all coins on the legend. then only select the global average which is the average across all tickers.
easy to spot global dips and pumps.
now that we know where major price moves occur across the market, turn on all coins. then look for strength and weakness.
we can see ltc recovers fast and continues to increase.
on the other side, we see 1000pepe show no strength and it continues remaining flat/the weakest out of all the selected coins.
easy to find strength / weakness on the hyblock spaghetti chart.


XRP. The largest predicted liquidity cluster gets hit and surprise surprise, we see a large liquidation event occur at the exact candle (5m timeframe).
Other data providers: “lots of liquidity above” with no real proof of accuracy or tracking.
Hyblock: liqs predicted -> liqs triggered. Shown in real time. Over and over. At the most granular levels.


we're seeing spaghetti charts all over our feed.
so a friendly reminder that hyblock has one of the best spaghetti charts in the industry.
(in the video) you'll see the same functionality that everyones spaghetti chart has: cumulative price change% over n number of coins. easy.
but what are we offering that's different?
- spaghetti chart on any indicator (not just price). want to see which coin has the fastest growing orderbook delta? done. slowest growing retail long%? done.
- easy formula-adds and a good variety: RSI, SMA, EMA, rolling percentile on any of those indicators.
- select any category of coins: listed equities, layer 1 coins, memecoins etc. to via the spaghetti chart on
- a variety of lookbacks from locking it to a few hours ago all the way back to up to 3 months.
enjoy :)
the basic use case: when everything dips, see which tickers are the first to bounce back. often those are the
coins with strength.
the advanced use case: open another spaghetti chart and add another indicator like open interest or bid ask ratio and find the same and look for tickers with confluence.
(ie. coins that recover the faster coupled with the fastest OI growth)
The formula for change% is: (close[t]/close[t-N] - 1)*100
so if you want to identify large changes in price, it can be easily done now.
if you want to identify big adds or drops in bids over 1 (or n number of candles), can easily be done now.
if you want to find the above use cases, expand it out to 10+ indicators, and then look for confluence, can easily be done now.
FLASH SALE 🫡
We’ve had a wave of new users discovering Hyblock today, so we’re opening up a rare one-off discount:
20% off ALL plans
code: welcomehbc
*includes Professional + API access, which we rarely discount. limited time only (probably 12-24 hrs)
Liquidation heatmaps, order flow, global metrics, proprietary metrics, formulas, backtesting + more.
Welcome sir 🫡 and welcome to all the new Hyblock users.
We hope the liquidation heatmaps don’t let anyone down. We put a lot of work into maintaining their accuracy.
A few things new users may enjoy digging into that are a little different from the usual crypto data platforms:
Global + Category Metrics: Aggregating BTC across exchanges is common. We go a step further and aggregate 1,000+ tickers across coins + exchanges, so you can see things like orderbook imbalance across the entire crypto universe. You can also isolate categories like L1s, listed equities, etc.
Visualizations: 3D charts, historical market screeners, not just current snapshots, coin quadrants, heatmaps and a lot more inside the terminal.
Formula Builder: Apply formulas to essentially any metric. Anchored CVD, RSI of bid/ask ratio, rolling percentiles with custom windows, combinations of metrics, etc.
Proprietary market-structure data: Slippage per candle/trade, bot activity estimates, buy/sell walls using limit + market order behavior, real-time bid/ask spread on every orderbook state change, and more. Our research team regularly publishes deep dives around these.
And then there’s backtesting + strategy building/automation, so the idea is to go from see something → test it → systematize it (live trading).
Welcome to Hyblock 🤝

RIP @coinglass_com
Sorry, but I don't trust the Apex Predator class (Binance now owns them) feeding me the data I use to make trading decisions.
As of today I'm a @hyblockcapital customer.
Coinglass - we had good times. I'll miss you.

A and B: at the exact 5m candle (08:45 UTC and 09:30), as price falls, it hits two large long liq clusters. And what happens? We see large long liquidations occur at that exact candle.
C: Price then rises towards the lone short liq cluster. At that exact timestamp, when the candle hits it, what happens? Large short liquidations occur.
Surprise surprise. liqs predicted => liqs triggered.


give your agent / trading strategies institutional-grade liq heatmap across 1min timeframe (going back ~3y) on over 1000+ tickers.
Multiple exchange support: hyblockcapital.com/api
All we've been doing is showing liqs predicted => liqs triggered, at the lowest granularity, across coins. what else do you want?
