
Interventional Stroke Neurologist @JJHospitalMumbai @DCNSNeuro
- Tweets1.4K
- Following338
- Followers286
- Likes2.9K









ALT Representative computed tomography angiographic images for purely hypodense plaque (A, sagittal), mixed hypodense and calcified plaque (B, sagittal), irregular plaque (C, sagittal), carotid web (D, sagittal), carotid dissection and ulceration (E, sagittal) and intraluminal thrombus (F, axial).


ALT Diffuse sinus thrombosis involving posterior part of SSS with bilateral sigmoid sinus thrombosis


ALT Figure 1 How does neuroimaging affect endovascular thrombectomy (EVT) decisions? A mosaic plot with a contingency table overlay is used to display the distribution of 870 cases (30 patients x 29 raters) and the corresponding decisions for or against EVT) between two imaging protocols. All percentages are based on the denominator of 870. All box sizes are proportional to the magnitude of decisions. For instance, the lower left box represents the 10.1% (88/870) of all decisions. In this box, EVT was not recommended on non-perfusion neuroimaging but recommended on perfusion neuroimaging. Conversely the upper right quadrant of the plot signifies cases where EVT was recommended based on non-perfusion neuroimaging but not on perfusion neuroimaging (11.3%, 98/870). Figure 2 Inter-rater agreement for endovascular thrombectomy between two surveys.


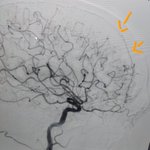
ALT Left ICA shoot

ALT Left ICA shoot


