

https://xitter.cf/t.co/JLdnz9N75L ⋅ https://xitter.cf/t.co/Zgs3PTOipj ⋅ https://xitter.cf/t.co/LMhOeOilJI ⋅ https://xitter.cf/t.co/pKCdI4Fcff
Joined April 2015
- Tweets4.7K
- Following744
- Followers6.2K
- Likes4.1K







Pinned Tweet
unusualbreakouts.com now have charts and theme detection became much stronger


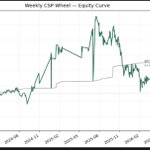
6/ My market filters skipped 22 of the 50.
They still make the system better overall: fewer losers, smaller drawdowns.
But it's not free, and I show every one they missed.
7/ Every trade has a full year of chart before entry, every execution, and what actually happened.
All 50 here:
unusualbreakouts.com/learn/t…

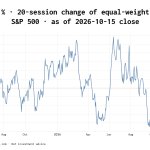
Many breakouts traders talk about breadth - when the index is up but most stocks aren't breakouts fail.
So I backtested it with actual numbers. This is what I found:
• RSP/SPY down in 20 days → breakouts lost money
• when 80% or more of S&P500 stocks above 50sma -breakouts don't work.
• when 80% or more of S&P500 stocks above 50 sma - breakouts don't work.
unusualbreakouts.com/learn/f…


Stanley Druckenmiller is famous for saying that earnings move individual stocks, but liquidity moves the market.
I listened to many of his public speeches and came out with a macro score that represents his views.
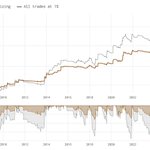
His macro score took my b/o strategy backtest from 22% to 33% CAGR.
But only on top of individual stock fundementals.
What macro parameters have an edge?
1. Financial conditions - 3-month change in the dollar, the 10-year yield, oil, credit spreads (HYG vs IEF) and the S&P. Each one moving the wrong way costs points.
2. Excess liquidity - M2 money supply growth minus industrial production growth. Money growing faster than the economy spills into assets.
3. The Fed - A rate cut in the last 6 months scores 3. A recent hike scores 0. QE adds, QT subtracts.
4. Companies and sector cycle - Fixed at neutral. Reading earnings calls point-in-time wasn't possible, so they never move the score.
Full research with backtest results:
unusualbreakouts.com/learn/f…


I scored 1,837 breakouts with Peter Lynch's valuation checks, using only SEC filings that existed before each trade.
Max drawdown went from −38% to −19%.
Return kept: 20% CAGR vs 23%.
The cheapest stocks were the worst breakouts.
Here's the full research:
unusualbreakouts.com/learn/f…
